
Seller's Agent in 2020
Bob Carey
Carey Realty Group, Inc.
(774) 306-1342
67 Total Sales
Estimated Value: $791,000 - $842,000
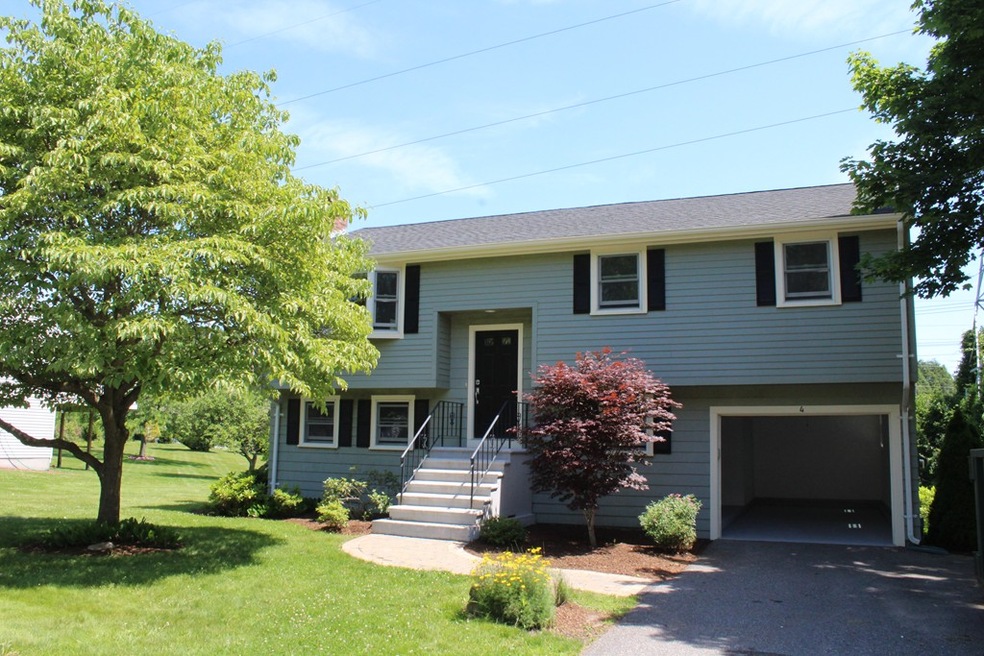
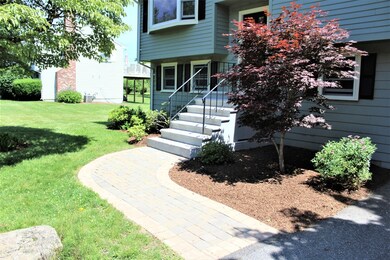
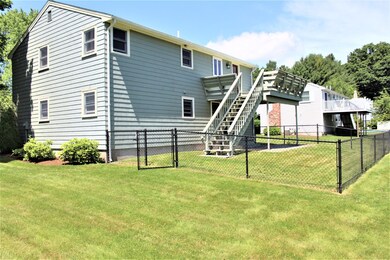
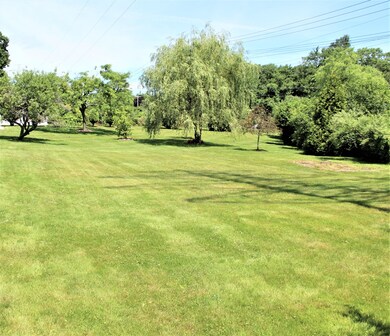
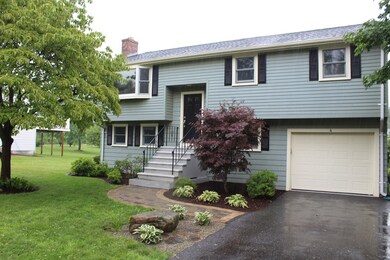
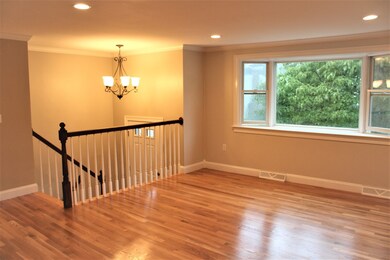
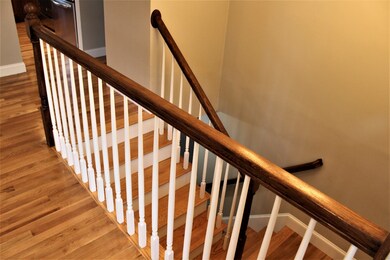
BUYER REMORSE THEIR LOSS YOUR GAIN~MOTIVATED SELLER~SELLER SAYS "BRING OFFERS!"~WELCOME HOME TO THIS RECENT REMODELED HOME BY LOCAL BUILDER IN VERY DESIRABLE NEIGHBORHOOD CLOSE TO EVERYTHING FROM SCHOOLS, SHOPPING, RESTAURANTS, COMMUTER RAIL TO BOSTON~RAISED RANCH w/8 ROOMS/3 BEDROOMS/2 FULL BATHS/1 OVER SIZED GARAGE~WALK OUT LOWER LEVEL TO BRICK PATIO AND LEVEL BACK YARD~DECK OFF KITCHEN PERFECT FOR OUTDOOR ENTERTAINING~OPEN CONCEPT w/LIVING ROOM/DINING/KITCHEN~MIX OF OAK FLOORS, TILE, CARPET~SS APPLIANCES, GRANITE COUNTERS, CUSTOM KITCHEN CABINETS~CROWN MOLDING~CUSTOM STAIRCASE w/OAK RAILING AND CUSTOM SPINDLES~MANY UPGRADES ADDED~FIREPLACE FAMILY ROOM IN LOWER LEVEL~TOWN WATER~TOWN SEWER~NATURAL GAS HEAT~CENTRAL AIR~DOESN'T GET MUCH BETTER THAN THIS CALL TODAY~A MUST SEE~PURCHASE-PACK & MOVE IN!~CALL TODAY~
Last Buyer's Agent
Katherine Larose
Keller Williams Pinnacle Central
We collect this data history from publicly available records. To have your information removed, we recommend requesting removal directly through your county’s website.
We collect this data history from publicly available records. To have your information removed, we recommend requesting removal directly through your county’s website.
| Date | Buyer | Sale Price | Title Company |
|---|---|---|---|
| -- | -- | ||
| $515,000 | None Available | ||
| $340,000 | -- | ||
| $340,000 | -- | ||
| $141,000 | -- | ||
| $141,000 | -- | ||
| $190,000 | -- | ||
| $190,000 | -- | ||
| $173,000 | -- |
We collect this data history from publicly available records. To have your information removed, we recommend requesting removal directly through your county’s website.
| Date | Status | Borrower | Loan Amount |
|---|---|---|---|
| Previous Owner | $412,000 | ||
| Previous Owner | $119,504 | ||
| Previous Owner | $125,000 | ||
| Previous Owner | $137,000 |
We collect this data history from publicly available records. To have your information removed, we recommend requesting removal directly through your county’s website.
| Date | Event | Price | List to Sale | Price per Sq Ft | Prior Sale |
|---|---|---|---|---|---|
| 03/10/2020 03/10/20 | Sold | $515,000 | 0.0% | $328 / Sq Ft | |
| 01/28/2020 01/28/20 | Pending | -- | -- | -- | |
| 01/08/2020 01/08/20 | Price Changed | $515,000 | 0.0% | $328 / Sq Ft | |
| 01/08/2020 01/08/20 | For Sale | $515,000 | -1.9% | $328 / Sq Ft | |
| 12/24/2019 12/24/19 | Pending | -- | -- | -- | |
| 10/31/2019 10/31/19 | Price Changed | $525,000 | -4.5% | $334 / Sq Ft | |
| 09/10/2019 09/10/19 | For Sale | $550,000 | 0.0% | $350 / Sq Ft | |
| 09/05/2019 09/05/19 | Pending | -- | -- | -- | |
| 08/06/2019 08/06/19 | Price Changed | $550,000 | -1.8% | $350 / Sq Ft | |
| 07/12/2019 07/12/19 | For Sale | $560,000 | 0.0% | $356 / Sq Ft | |
| 03/07/2018 03/07/18 | Rented | $3,200 | 0.0% | -- | |
| 03/07/2018 03/07/18 | Under Contract | -- | -- | -- | |
| 12/27/2017 12/27/17 | For Rent | $3,200 | 0.0% | -- | |
| 06/15/2017 06/15/17 | Rented | $3,200 | 0.0% | -- | |
| 06/14/2017 06/14/17 | Under Contract | -- | -- | -- | |
| 06/03/2017 06/03/17 | For Rent | $3,200 | +3.2% | -- | |
| 11/22/2014 11/22/14 | Rented | $3,100 | 0.0% | -- | |
| 10/23/2014 10/23/14 | Under Contract | -- | -- | -- | |
| 10/06/2014 10/06/14 | For Rent | $3,100 | 0.0% | -- | |
| 05/24/2014 05/24/14 | Sold | $340,000 | -5.6% | $331 / Sq Ft | View Prior Sale |
| 05/04/2014 05/04/14 | Pending | -- | -- | -- | |
| 04/15/2014 04/15/14 | Price Changed | $359,999 | -1.4% | $350 / Sq Ft | |
| 02/04/2014 02/04/14 | Price Changed | $364,999 | -3.9% | $355 / Sq Ft | |
| 01/22/2014 01/22/14 | For Sale | $380,000 | +11.8% | $370 / Sq Ft | |
| 01/14/2014 01/14/14 | Off Market | $340,000 | -- | -- | |
| 10/26/2013 10/26/13 | For Sale | $380,000 | -- | $370 / Sq Ft |
We collect this data history from publicly available records. To have your information removed, we recommend requesting removal directly through your county’s website.
| Year | Tax Paid | Tax Assessment Tax Assessment Total Assessment is a certain percentage of the fair market value that is determined by local assessors to be the total taxable value of land and additions on the property. | Land | Improvement |
|---|---|---|---|---|
| 2025 | $7,479 | $625,300 | $393,300 | $232,000 |
| 2024 | $7,236 | $590,200 | $370,200 | $220,000 |
| 2023 | $7,195 | $569,200 | $355,300 | $213,900 |
| 2022 | $6,955 | $521,400 | $322,100 | $199,300 |
| 2021 | $6,655 | $489,000 | $303,700 | $185,300 |
| 2020 | $6,467 | $475,200 | $289,900 | $185,300 |
| 2019 | $6,040 | $475,200 | $289,900 | $185,300 |
| 2018 | $5,891 | $451,400 | $276,100 | $175,300 |
| 2017 | $5,517 | $409,000 | $237,100 | $171,900 |
| 2016 | $5,273 | $388,600 | $218,200 | $170,400 |
| 2015 | $4,706 | $340,500 | $218,200 | $122,300 |
Seller's Agent in 2020
Bob Carey
Carey Realty Group, Inc.
(774) 306-1342
67 Total Sales
K
Buyer's Agent in 2020
Katherine Larose
Keller Williams Pinnacle Central
S
Seller's Agent in 2018
Susan Proctor
Laer Realty
Buyer's Agent in 2018
Noreen Boyce
Gibson Sotheby's International Realty
(617) 749-5308
7 Total Sales
Buyer's Agent in 2017
Tracy Johnson
Chase Hathaway Residential
(617) 595-2600
6 Total Sales
E
Seller's Agent in 2014
Elaine Payton
Choice Real Estate
Source: MLS Property Information Network (MLS PIN)
MLS Number: 72533286
APN: NATI-000040-000000-000216
Disclaimer: Certain information contained herein is derived from information provided by parties other than Homes.com. All information provided is deemed reliable, but is not guaranteed to be accurate and should be independently verified.
![]() The property listing data and information, or the Images, set forth herein were provided to MLS Property Information Network, Inc. from third party sources, including sellers, lessors and public records, and were compiled by MLS Property Information Network, Inc. The property listing data and information, and the Images, are for the personal, non-commercial use of consumers having a good faith interest in purchasing or leasing listed properties of the type displayed to them and may not be used for any purpose other than to identify prospective properties which such consumers may have a good faith interest in purchasing or leasing. MLS Property Information Network, Inc. and its subscribers disclaim any and all representations and warranties as to the accuracy of the property listing data and information, or as to the accuracy of any of the Images, set forth herein.
The property listing data and information, or the Images, set forth herein were provided to MLS Property Information Network, Inc. from third party sources, including sellers, lessors and public records, and were compiled by MLS Property Information Network, Inc. The property listing data and information, and the Images, are for the personal, non-commercial use of consumers having a good faith interest in purchasing or leasing listed properties of the type displayed to them and may not be used for any purpose other than to identify prospective properties which such consumers may have a good faith interest in purchasing or leasing. MLS Property Information Network, Inc. and its subscribers disclaim any and all representations and warranties as to the accuracy of the property listing data and information, or as to the accuracy of any of the Images, set forth herein.
Ask me questions while you tour the home.