40 Brown St Marblehead, MA 01945
Estimated Value: $1,984,000 - $2,167,000
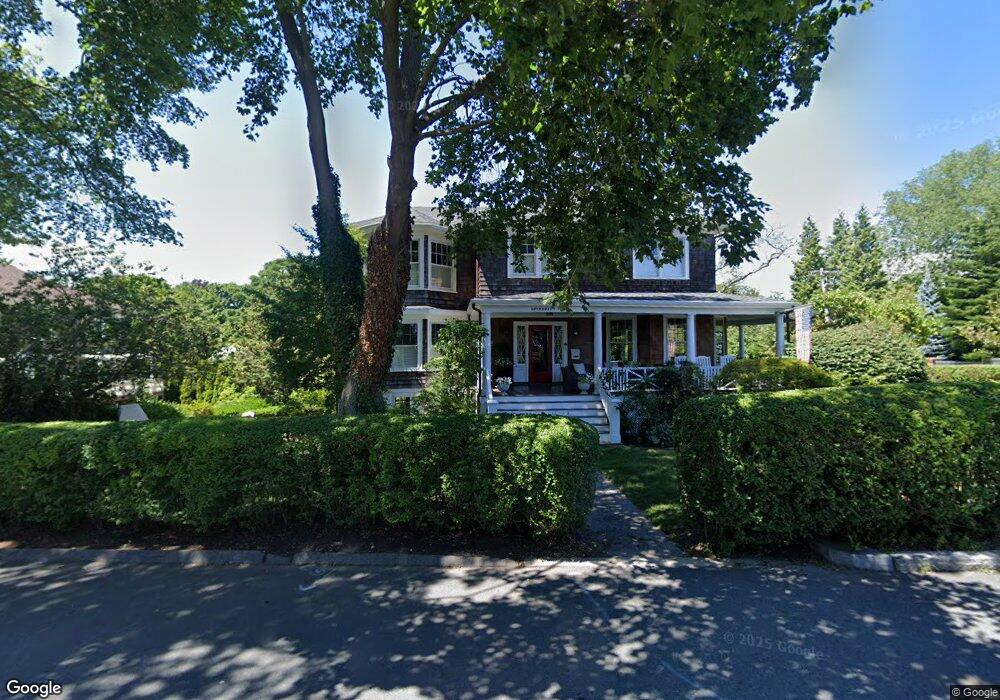
About This Home
This home is located at 40 Brown St, Marblehead, MA 01945 and is currently estimated at $2,053,999, approximately $811 per square foot. 40 Brown St is a home located in Essex County with nearby schools including Marblehead High School, Devereux School, and Tower School.
Ownership History
We collect this data history from publicly available records. To have your information removed, we recommend requesting removal directly through your county’s website.
Purchase Details
Home Financials for this Owner
Home Financials are based on the most recent Mortgage that was taken out on this home.Purchase Details
Home Values in the Area
Average Home Value in this Area
Purchase History
We collect this data history from publicly available records. To have your information removed, we recommend requesting removal directly through your county’s website.
| Date | Buyer | Sale Price | Title Company |
|---|---|---|---|
| $960,000 | -- | ||
| $960,000 | -- | ||
| -- | -- | ||
| -- | -- |
Mortgage History
We collect this data history from publicly available records. To have your information removed, we recommend requesting removal directly through your county’s website.
| Date | Status | Borrower | Loan Amount |
|---|---|---|---|
| Open | $1,120,000 | ||
| Closed | $768,000 | ||
| Closed | $95,950 |
Tax History
We collect this data history from publicly available records. To have your information removed, we recommend requesting removal directly through your county’s website.
| Year | Tax Paid | Tax Assessment Tax Assessment Total Assessment is a certain percentage of the fair market value that is determined by local assessors to be the total taxable value of land and additions on the property. | Land | Improvement |
|---|---|---|---|---|
| 2025 | $15,480 | $1,710,500 | $1,121,400 | $589,100 |
| 2024 | $17,858 | $1,993,100 | $1,424,800 | $568,300 |
| 2023 | $14,684 | $1,468,400 | $1,015,900 | $452,500 |
| 2022 | $14,644 | $1,392,000 | $949,900 | $442,100 |
| 2021 | $14,158 | $1,358,700 | $923,500 | $435,200 |
| 2020 | $14,600 | $1,405,200 | $989,500 | $415,700 |
| 2019 | $13,488 | $1,255,900 | $857,500 | $398,400 |
| 2018 | $12,823 | $1,163,600 | $765,200 | $398,400 |
| 2017 | $12,521 | $1,137,200 | $738,800 | $398,400 |
| 2016 | $11,567 | $1,042,100 | $686,000 | $356,100 |
| 2015 | $11,546 | $1,042,100 | $686,000 | $356,100 |
| 2014 | $10,196 | $919,400 | $659,600 | $259,800 |
Map
- 4 Ballast Ln
- 349 Ocean Ave
- 372 Ocean Ave
- 48 Harbor Ave
- 244 Ocean Ave
- 95 Front St Unit 1
- 11 Leslie Cove
- 29 & 31 Circle St
- 12 Darling St Unit 2
- 60 Brackett Place Unit D
- 9 Darling St
- 33 Franklin St
- 31 Franklin St
- 27 Waldron St
- 55 Gregory St
- 7 Fort Beach Way
- 8 Franklin St Unit 19
- 1 Red Frank Ln
- 44 Pleasant St Unit 1
- 20 Mechanic Square Unit 2
Ask me questions while you tour the home.