40 Calf Pasture Beach Rd Norwalk, CT 06855
East Norwalk NeighborhoodEstimated Value: $949,000 - $1,294,606
About This Home
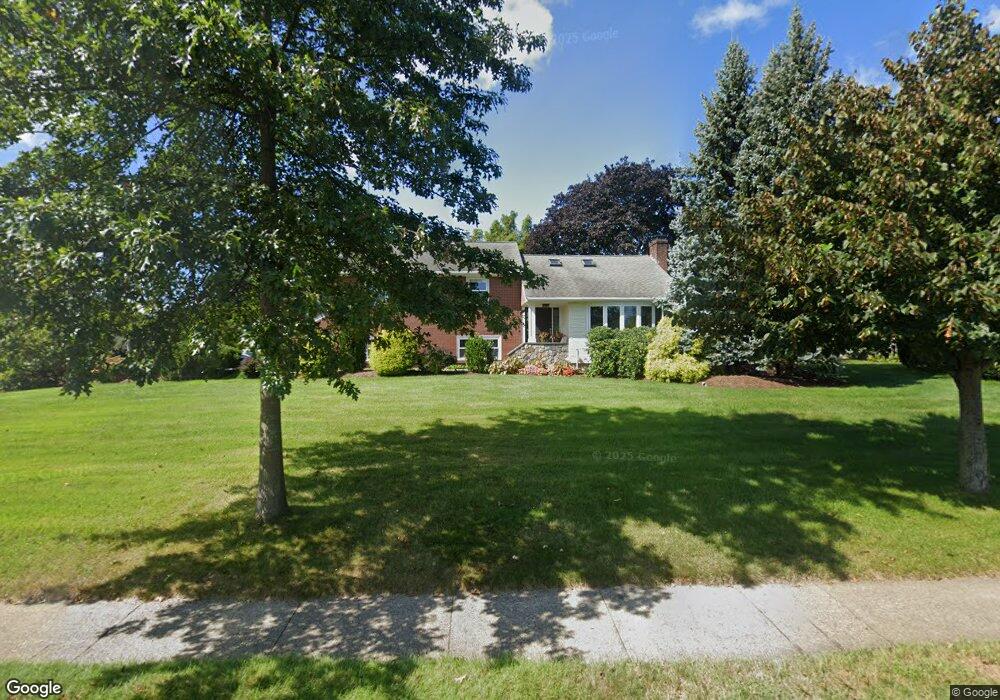
This home is located at 40 Calf Pasture Beach Rd, Norwalk, CT 06855 and is currently estimated at $1,082,652, approximately $521 per square foot. 40 Calf Pasture Beach Rd is a home located in Fairfield County with nearby schools including Marvin Elementary School, Nathan Hale Middle School, and Norwalk High School.
Ownership History
We collect this data history from publicly available records. To have your information removed, we recommend requesting removal directly through your county’s website.
Purchase Details
Purchase Details
Home Values in the Area
Average Home Value in this Area
Purchase History
We collect this data history from publicly available records. To have your information removed, we recommend requesting removal directly through your county’s website.
| Date | Buyer | Sale Price | Title Company |
|---|---|---|---|
| $694,900 | -- | ||
| $694,900 | -- | ||
| $285,000 | -- | ||
| $285,000 | -- |
Mortgage History
We collect this data history from publicly available records. To have your information removed, we recommend requesting removal directly through your county’s website.
| Date | Status | Borrower | Loan Amount |
|---|---|---|---|
| Open | $90,000 | ||
| Open | $732,000 |
Tax History
We collect this data history from publicly available records. To have your information removed, we recommend requesting removal directly through your county’s website.
| Year | Tax Paid | Tax Assessment Tax Assessment Total Assessment is a certain percentage of the fair market value that is determined by local assessors to be the total taxable value of land and additions on the property. | Land | Improvement |
|---|---|---|---|---|
| 2025 | $14,105 | $590,170 | $308,750 | $281,420 |
| 2024 | $13,896 | $590,170 | $308,750 | $281,420 |
| 2023 | $10,116 | $403,240 | $162,740 | $240,500 |
| 2022 | $9,898 | $403,240 | $162,740 | $240,500 |
| 2021 | $9,666 | $403,240 | $162,740 | $240,500 |
| 2020 | $9,660 | $403,240 | $162,740 | $240,500 |
| 2019 | $9,402 | $403,240 | $162,740 | $240,500 |
| 2018 | $10,414 | $391,420 | $176,200 | $215,220 |
| 2017 | $10,052 | $391,420 | $176,200 | $215,220 |
| 2016 | $9,958 | $391,420 | $176,200 | $215,220 |
| 2015 | $9,930 | $391,420 | $176,200 | $215,220 |
| 2014 | $9,802 | $391,420 | $176,200 | $215,220 |
Map
- 7 Elliott St
- 199 Gregory Blvd Unit E4
- 10 Elliott St
- 15 Marion Ave
- 3 Shorehaven Rd
- 9 Sylvester Ct
- 10 Shorehaven Rd
- 8 Roland Ave
- 108 Gregory Blvd
- 2 Marvin St
- 3 Canfield Crossing
- 66 Cove Ave
- 12 Ludlow Manor
- 10 Ludlow Manor
- 26 Cove Ave Unit 3B
- 54 1st St
- 100 Seaview Ave Unit 4F
- 100 Seaview Ave Unit 2J
- 11 Bethel St
- 30 Shorefront Park
Ask me questions while you tour the home.