40 Cassie Ln Uxbridge, MA 01569
Estimated Value: $596,000 - $833,000
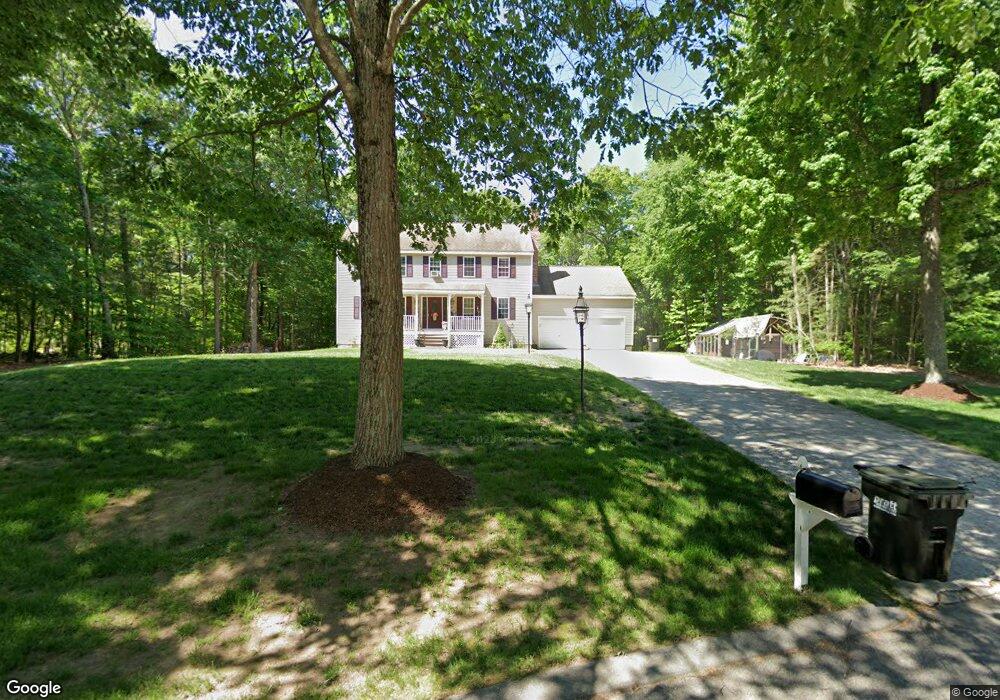
About This Home
This home is located at 40 Cassie Ln, Uxbridge, MA 01569 and is currently estimated at $696,974, approximately $308 per square foot. 40 Cassie Ln is a home located in Worcester County with nearby schools including Uxbridge High School and Our Lady of the Valley Regional School.
Ownership History
We collect this data history from publicly available records. To have your information removed, we recommend requesting removal directly through your county’s website.
Purchase Details
Home Financials for this Owner
Home Financials are based on the most recent Mortgage that was taken out on this home.Home Values in the Area
Average Home Value in this Area
Purchase History
We collect this data history from publicly available records. To have your information removed, we recommend requesting removal directly through your county’s website.
| Date | Buyer | Sale Price | Title Company |
|---|---|---|---|
| $287,030 | -- |
Mortgage History
We collect this data history from publicly available records. To have your information removed, we recommend requesting removal directly through your county’s website.
| Date | Status | Borrower | Loan Amount |
|---|---|---|---|
| Open | $150,000 | ||
| Closed | $130,500 | ||
| Closed | $225,500 | ||
| Closed | $236,000 |
Tax History
We collect this data history from publicly available records. To have your information removed, we recommend requesting removal directly through your county’s website.
| Year | Tax Paid | Tax Assessment Tax Assessment Total Assessment is a certain percentage of the fair market value that is determined by local assessors to be the total taxable value of land and additions on the property. | Land | Improvement |
|---|---|---|---|---|
| 2025 | $80 | $607,500 | $174,700 | $432,800 |
| 2024 | $7,552 | $584,500 | $166,000 | $418,500 |
| 2023 | $7,202 | $516,300 | $143,200 | $373,100 |
| 2022 | $6,523 | $430,300 | $125,800 | $304,500 |
| 2021 | $6,766 | $427,700 | $123,200 | $304,500 |
| 2020 | $6,639 | $396,600 | $121,400 | $275,200 |
| 2019 | $6,570 | $378,700 | $121,400 | $257,300 |
| 2018 | $6,399 | $372,700 | $121,400 | $251,300 |
| 2017 | $5,899 | $347,800 | $111,700 | $236,100 |
| 2016 | $6,127 | $348,700 | $106,400 | $242,300 |
| 2015 | $5,984 | $343,900 | $106,400 | $237,500 |
Map
- 150 Hazel St
- 21 Concord Ln Unit 21
- 15 Gervais Way
- 28 Cross Rd
- 545 Hazel St
- 42 Brookside Dr
- 101 Hunter Rd
- 113 Hazel St
- 117 Saint Andre Dr
- 115 Hunter Rd
- 71 Rivulet St Unit B
- 6 Chamberlain Rd
- 138 Elm St
- 583 Fletcher St
- 551 Fletcher St
- 23 Yale St Unit 23
- 60 Rogerson Crossing Unit 60
- 14 Seagrave St Unit 14
- 11 Boston St
- 26 Bayliss Way
Ask me questions while you tour the home.