40 Clark St Chatham, NJ 07928
Estimated Value: $1,569,000 - $1,966,000
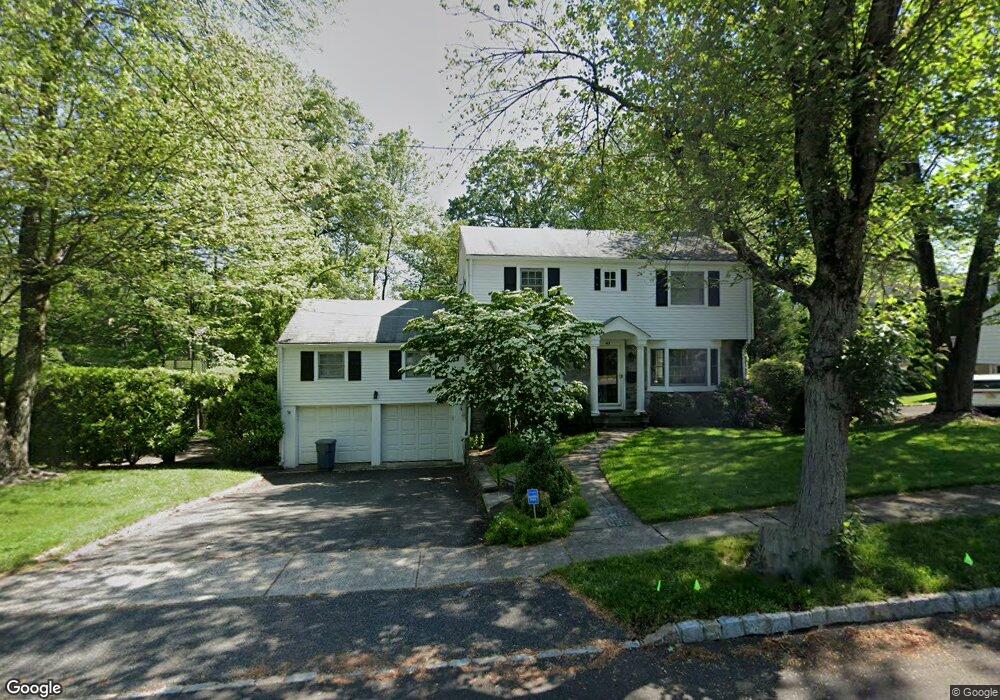
About This Home
This home is located at 40 Clark St, Chatham, NJ 07928 and is currently estimated at $1,730,196, approximately $604 per square foot. 40 Clark St is a home located in Morris County with nearby schools including Chatham High School, St. Patrick School, and ECLC of New Jersey.
Ownership History
We collect this data history from publicly available records. To have your information removed, we recommend requesting removal directly through your county’s website.
Purchase Details
Home Financials for this Owner
Home Financials are based on the most recent Mortgage that was taken out on this home.Home Values in the Area
Average Home Value in this Area
Purchase History
We collect this data history from publicly available records. To have your information removed, we recommend requesting removal directly through your county’s website.
| Date | Buyer | Sale Price | Title Company |
|---|---|---|---|
| $1,200,100 | None Available |
Mortgage History
We collect this data history from publicly available records. To have your information removed, we recommend requesting removal directly through your county’s website.
| Date | Status | Borrower | Loan Amount |
|---|---|---|---|
| Open | $400,000 |
Tax History
We collect this data history from publicly available records. To have your information removed, we recommend requesting removal directly through your county’s website.
| Year | Tax Paid | Tax Assessment Tax Assessment Total Assessment is a certain percentage of the fair market value that is determined by local assessors to be the total taxable value of land and additions on the property. | Land | Improvement |
|---|---|---|---|---|
| 2025 | $19,044 | $1,176,300 | $702,900 | $473,400 |
| 2024 | $18,935 | $1,176,300 | $702,900 | $473,400 |
| 2023 | $18,935 | $1,218,500 | $702,900 | $515,600 |
| 2022 | $18,675 | $873,900 | $517,400 | $356,500 |
| 2021 | $18,675 | $873,900 | $517,400 | $356,500 |
| 2020 | $18,518 | $873,900 | $517,400 | $356,500 |
| 2019 | $18,387 | $873,900 | $517,400 | $356,500 |
| 2018 | $17,871 | $873,900 | $517,400 | $356,500 |
| 2017 | $17,356 | $873,900 | $517,400 | $356,500 |
| 2016 | $16,901 | $873,900 | $517,400 | $356,500 |
| 2015 | $16,700 | $873,900 | $517,400 | $356,500 |
| 2014 | $16,578 | $873,900 | $517,400 | $356,500 |
Map
- 14 John St
- 177 Weston Ave
- 114 Coleman Ave
- 62 Weston Ave
- 12 Duchamp Place
- 40 Elmwood Ave
- 7 Meadow Rd
- 44 Brooklake Rd
- 22 Woodland Rd
- 159 N Passaic Ave
- 9 Niles Ave
- 22 Essex Rd
- 58 Brooklake Rd Unit 21
- 111 N Summit Ave
- 175 N Passaic Ave
- 9 N Hillside Ave
- 85 Kings Rd
- 20 Beechwood Rd
- 8 Hedges Ave
- 99 Beechwood Rd
Ask me questions while you tour the home.