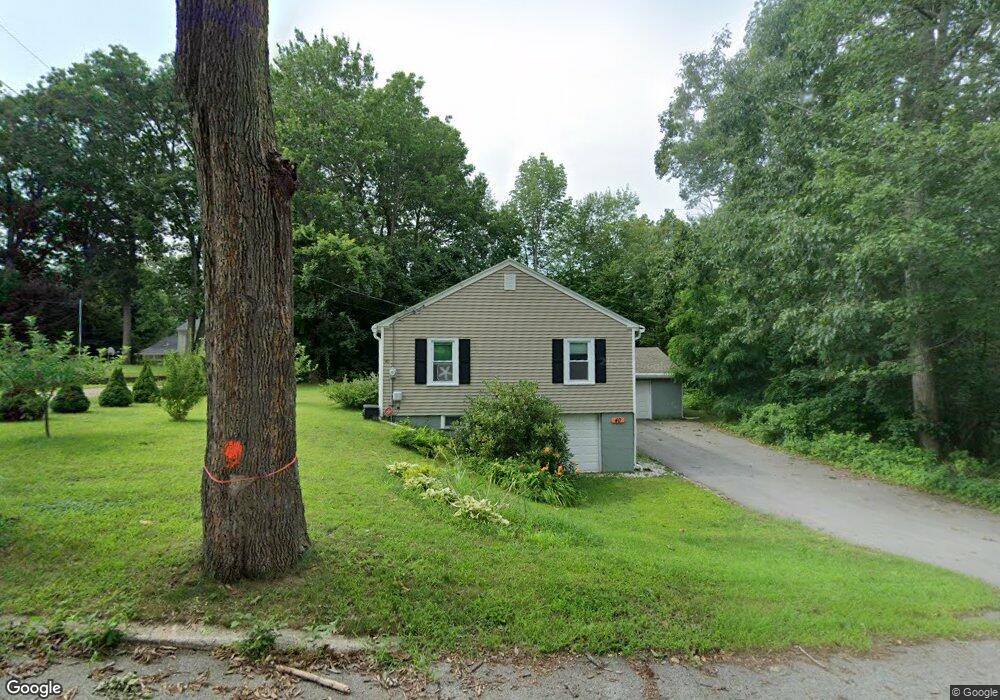
40 First St Berwick, ME 03901
Estimated Value: $386,708 - $583,000
3
Beds
1
Bath
1,420
Sq Ft
$314/Sq Ft
Est. Value
About This Home
This home is located at 40 First St, Berwick, ME 03901 and is currently estimated at $446,177, approximately $314 per square foot. 40 First St is a home located in York County with nearby schools including Noble High School and Tri-City Christian Academy.
Ownership History
Date
Name
Owned For
Owner Type
Purchase Details
Closed on
Oct 1, 2013
Sold by
Upkeep Maintenance Inc
Bought by
Morel Tristan M
Current Estimated Value
Home Financials for this Owner
Home Financials are based on the most recent Mortgage that was taken out on this home.
Original Mortgage
$169,750
Outstanding Balance
$125,224
Interest Rate
4.42%
Mortgage Type
Purchase Money Mortgage
Estimated Equity
$320,953
Purchase Details
Closed on
Jan 22, 2013
Sold by
Bank New York Mellon Tr
Bought by
Upkeep Maintenance Inc
Create a Home Valuation Report for This Property
The Home Valuation Report is an in-depth analysis detailing your home's value as well as a comparison with similar homes in the area
Home Values in the Area
Average Home Value in this Area
Purchase History
| Date | Buyer | Sale Price | Title Company |
|---|---|---|---|
| Morel Tristan M | -- | -- | |
| Upkeep Maintenance Inc | -- | -- |
Source: Public Records
Mortgage History
| Date | Status | Borrower | Loan Amount |
|---|---|---|---|
| Open | Morel Tristan M | $169,750 |
Source: Public Records
Tax History
| Year | Tax Paid | Tax Assessment Tax Assessment Total Assessment is a certain percentage of the fair market value that is determined by local assessors to be the total taxable value of land and additions on the property. | Land | Improvement |
|---|---|---|---|---|
| 2025 | $4,852 | $372,100 | $129,000 | $243,100 |
| 2024 | $4,640 | $372,100 | $129,000 | $243,100 |
| 2023 | $3,794 | $207,100 | $92,000 | $115,100 |
| 2022 | $3,773 | $207,100 | $92,000 | $115,100 |
| 2021 | $3,790 | $207,100 | $92,000 | $115,100 |
| 2020 | $2,298 | $204,300 | $92,000 | $112,300 |
| 2019 | $2,265 | $203,500 | $92,000 | $111,500 |
| 2018 | $3,499 | $198,800 | $87,700 | $111,100 |
| 2017 | $2,210 | $198,800 | $87,700 | $111,100 |
| 2016 | $2,210 | $198,800 | $87,700 | $111,100 |
| 2014 | $3,161 | $198,800 | $87,700 | $111,100 |
| 2013 | $3,191 | $198,800 | $87,700 | $111,100 |
Source: Public Records
Map
Nearby Homes
Your Personal Tour Guide
Ask me questions while you tour the home.