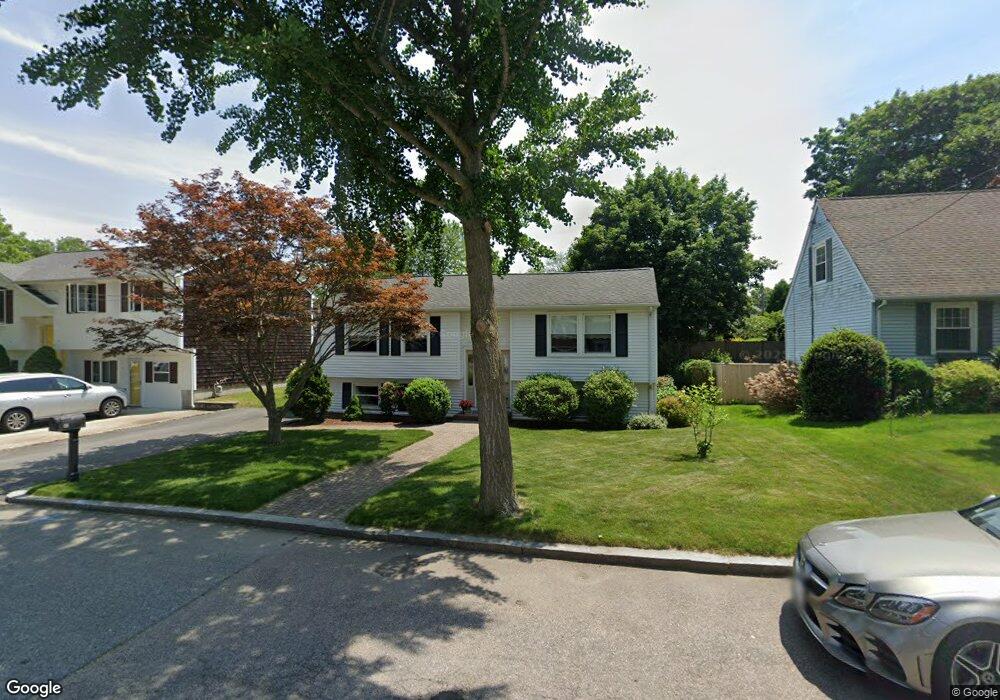
40 Lynde St Providence, RI 02908
Elmhurst NeighborhoodEstimated Value: $390,000 - $439,000
About This Home
This home is located at 40 Lynde St, Providence, RI 02908 and is currently estimated at $417,232, approximately $437 per square foot. 40 Lynde St is a home located in Providence County with nearby schools including Asa Messer Elementary School, Veazie Street Elementary School, and Harry Kizirian Elementary School.
Ownership History
We collect this data history from publicly available records. To have your information removed, we recommend requesting removal directly through your county’s website.
Purchase Details
Home Values in the Area
Average Home Value in this Area
Purchase History
We collect this data history from publicly available records. To have your information removed, we recommend requesting removal directly through your county’s website.
| Date | Buyer | Sale Price | Title Company |
|---|---|---|---|
| $84,000 | -- |
Mortgage History
We collect this data history from publicly available records. To have your information removed, we recommend requesting removal directly through your county’s website.
| Date | Status | Borrower | Loan Amount |
|---|---|---|---|
| Open | $76,000 | ||
| Closed | $100,000 | ||
| Closed | $143,000 | ||
| Closed | $93,600 | ||
| Closed | $18,000 | ||
| Closed | $80,000 |
Tax History
We collect this data history from publicly available records. To have your information removed, we recommend requesting removal directly through your county’s website.
| Year | Tax Paid | Tax Assessment Tax Assessment Total Assessment is a certain percentage of the fair market value that is determined by local assessors to be the total taxable value of land and additions on the property. | Land | Improvement |
|---|---|---|---|---|
| 2025 | $3,367 | $400,800 | $164,000 | $236,800 |
| 2024 | $5,507 | $300,100 | $106,600 | $193,500 |
| 2023 | $5,507 | $300,100 | $106,600 | $193,500 |
| 2022 | $5,342 | $300,100 | $106,600 | $193,500 |
| 2021 | $5,413 | $220,400 | $85,900 | $134,500 |
| 2020 | $5,413 | $220,400 | $85,900 | $134,500 |
| 2019 | $5,413 | $220,400 | $85,900 | $134,500 |
| 2018 | $5,456 | $170,700 | $69,100 | $101,600 |
| 2017 | $5,347 | $167,300 | $69,100 | $98,200 |
| 2016 | $5,347 | $167,300 | $69,100 | $98,200 |
| 2015 | $4,766 | $144,000 | $69,100 | $74,900 |
| 2014 | $4,860 | $144,000 | $69,100 | $74,900 |
| 2013 | $4,860 | $144,000 | $69,100 | $74,900 |
Map
- 63 Lynde St
- 42 Gentian Ave
- 52 Forbes St
- 111 Isabella Ave
- 68 Enfield Ave
- 96 Meridian St
- 64 Royal Ave
- 797 Academy Ave
- 31 Funston Ave
- 15 Modena Ave
- 53 Cathedral Ave
- 30 Naples Ave
- 0 Enfield Ave
- 269 Nelson St
- 928 Admiral St
- 354 Jastram St
- 393 Sharon St
- 41 Wellesley Ave
- 326 Sharon St
- 4 Smithfield Rd Unit 18
Ask me questions while you tour the home.