40 Maple St Westport, MA 02790
North Westport NeighborhoodEstimated Value: $445,895 - $494,000
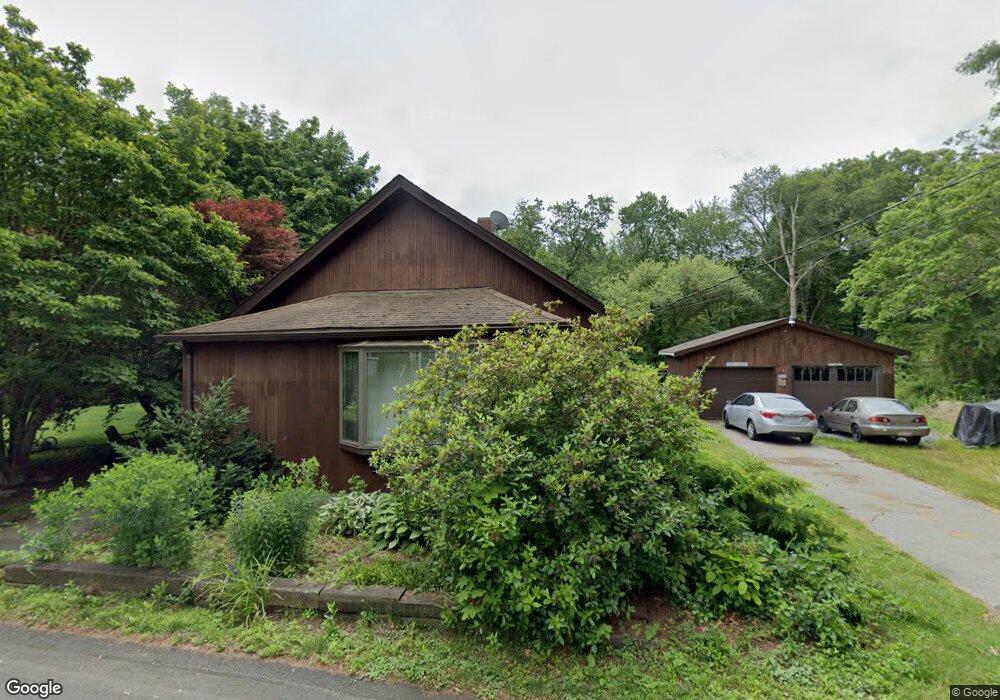
About This Home
This home is located at 40 Maple St, Westport, MA 02790 and is currently estimated at $474,974, approximately $323 per square foot. 40 Maple St is a home located in Bristol County with nearby schools including Alice A. Macomber Primary School, Westport Elementary School, and Westport Middle-High School.
Ownership History
We collect this data history from publicly available records. To have your information removed, we recommend requesting removal directly through your county’s website.
Purchase Details
Purchase Details
Home Values in the Area
Average Home Value in this Area
Purchase History
We collect this data history from publicly available records. To have your information removed, we recommend requesting removal directly through your county’s website.
| Date | Buyer | Sale Price | Title Company |
|---|---|---|---|
| -- | None Available | ||
| $111,000 | -- |
Mortgage History
We collect this data history from publicly available records. To have your information removed, we recommend requesting removal directly through your county’s website.
| Date | Status | Borrower | Loan Amount |
|---|---|---|---|
| Previous Owner | $289,240 | ||
| Previous Owner | $251,823 |
Tax History
We collect this data history from publicly available records. To have your information removed, we recommend requesting removal directly through your county’s website.
| Year | Tax Paid | Tax Assessment Tax Assessment Total Assessment is a certain percentage of the fair market value that is determined by local assessors to be the total taxable value of land and additions on the property. | Land | Improvement |
|---|---|---|---|---|
| 2025 | $2,429 | $326,100 | $147,200 | $178,900 |
| 2024 | $2,427 | $314,000 | $136,400 | $177,600 |
| 2023 | $2,255 | $276,400 | $123,700 | $152,700 |
| 2022 | $1,971 | $232,400 | $117,500 | $114,900 |
| 2021 | $3,804 | $221,800 | $106,800 | $115,000 |
| 2020 | $1,789 | $212,200 | $97,200 | $115,000 |
| 2019 | $10 | $207,800 | $97,200 | $110,600 |
| 2018 | $1,552 | $190,000 | $84,900 | $105,100 |
| 2017 | $1,538 | $193,000 | $90,700 | $102,300 |
| 2016 | $1,489 | $188,300 | $86,000 | $102,300 |
| 2015 | $1,469 | $185,200 | $98,800 | $86,400 |
Map
- 0 Island Unit 73536183
- 18 Gifford Rd
- 32 Madison Ct
- 68 Davis Rd
- 0 Hertitage Acres
- 350 Gifford Rd
- 125 Davis Rd
- 26 James Ave
- 100 O Dr
- 100 D Dr
- 7 Diane Way
- 3 Diane Way
- 343 Old Bedford Rd
- 258 Sanford Rd
- 1148 American Legion Hwy
- 1174 Old Fall River Rd
- 0 Bergeron Ln Unit 73483440
- 50 Benoit St
- 21 Evergreen St
- 706 Gifford Rd
Ask me questions while you tour the home.