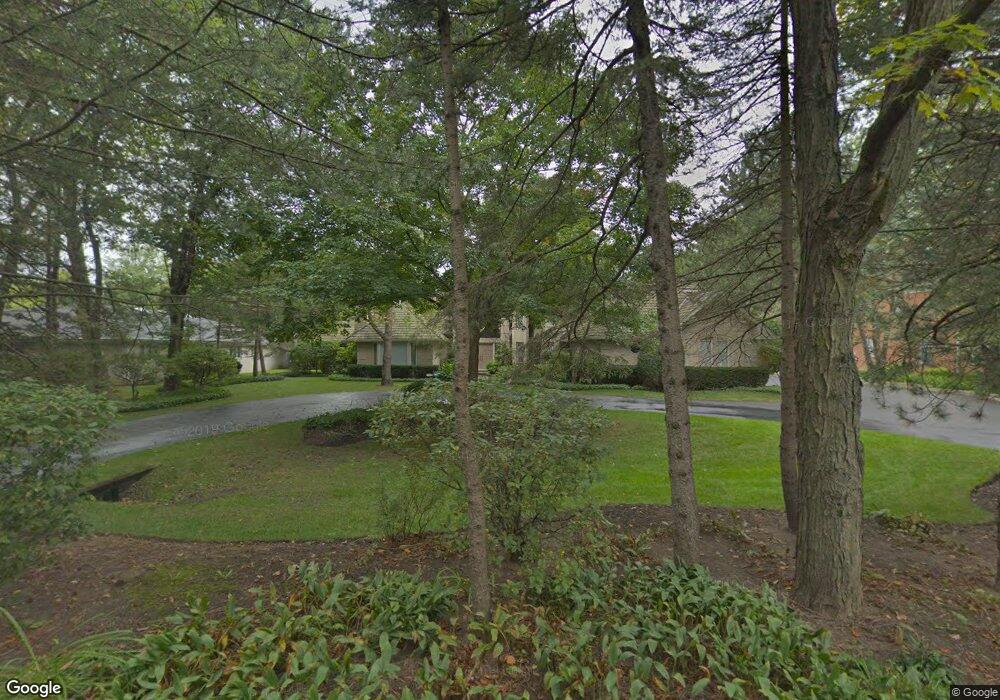
40 Meadowood Ln Northfield, IL 60093
Estimated Value: $1,319,000 - $1,752,000
5
Beds
6
Baths
3,182
Sq Ft
$500/Sq Ft
Est. Value
About This Home
This home is located at 40 Meadowood Ln, Northfield, IL 60093 and is currently estimated at $1,589,891, approximately $499 per square foot. 40 Meadowood Ln is a home located in Cook County with nearby schools including Lyon Elementary School, Pleasant Ridge Elementary School, and Attea Middle School.
Ownership History
Date
Name
Owned For
Owner Type
Purchase Details
Closed on
Jun 23, 2010
Sold by
Gapp Kevin T and Gapp Barri D
Bought by
Gapp Kevin T and The Kevin T Gapp Revocable Trust
Current Estimated Value
Purchase Details
Closed on
Mar 29, 2006
Sold by
Gapp Robert J
Bought by
Gapp Kevin T and Gapp Barri
Home Financials for this Owner
Home Financials are based on the most recent Mortgage that was taken out on this home.
Original Mortgage
$650,000
Outstanding Balance
$362,166
Interest Rate
6.22%
Mortgage Type
Unknown
Estimated Equity
$1,227,725
Purchase Details
Closed on
Feb 27, 1998
Sold by
Gapp Ruth Pifer
Bought by
Gapp Robert J
Home Financials for this Owner
Home Financials are based on the most recent Mortgage that was taken out on this home.
Original Mortgage
$550,000
Interest Rate
7.08%
Purchase Details
Closed on
May 13, 1997
Sold by
Gapp Ruth Pifer
Bought by
Gapp Ruth Pifer and Ruth Pifer Gapp Trust
Create a Home Valuation Report for This Property
The Home Valuation Report is an in-depth analysis detailing your home's value as well as a comparison with similar homes in the area
Home Values in the Area
Average Home Value in this Area
Purchase History
| Date | Buyer | Sale Price | Title Company |
|---|---|---|---|
| Gapp Kevin T | -- | None Available | |
| Gapp Kevin T | $1,300,000 | Chicago Title Insurance Co | |
| Gapp Robert J | $800,000 | -- | |
| Gapp Ruth Pifer | -- | -- |
Source: Public Records
Mortgage History
| Date | Status | Borrower | Loan Amount |
|---|---|---|---|
| Open | Gapp Kevin T | $650,000 | |
| Previous Owner | Gapp Robert J | $550,000 |
Source: Public Records
Tax History
| Year | Tax Paid | Tax Assessment Tax Assessment Total Assessment is a certain percentage of the fair market value that is determined by local assessors to be the total taxable value of land and additions on the property. | Land | Improvement |
|---|---|---|---|---|
| 2025 | $28,519 | $148,618 | $65,340 | $83,278 |
| 2024 | $28,519 | $129,164 | $60,984 | $68,180 |
| 2023 | $27,499 | $129,164 | $60,984 | $68,180 |
| 2022 | $27,499 | $129,164 | $60,984 | $68,180 |
| 2021 | $23,695 | $97,252 | $30,492 | $66,760 |
| 2020 | $23,432 | $97,252 | $30,492 | $66,760 |
| 2019 | $21,863 | $106,871 | $30,492 | $76,379 |
| 2018 | $20,880 | $93,754 | $26,136 | $67,618 |
| 2017 | $20,208 | $93,754 | $26,136 | $67,618 |
| 2016 | $19,155 | $93,754 | $26,136 | $67,618 |
| 2015 | $21,881 | $95,866 | $21,780 | $74,086 |
| 2014 | $21,498 | $95,866 | $21,780 | $74,086 |
| 2013 | $20,805 | $95,866 | $21,780 | $74,086 |
Source: Public Records
Map
Nearby Homes
- 1900 Winnetka Ave
- 118 Dickens Rd
- 2033 Winnetka Rd
- 1021 Linden Ln
- 1945 Bosworth Ln
- 320 Churchill St
- 8050 Arbor Ln Unit 303
- 1040 Arbor Ln Unit 1040
- 308 Happ Rd Unit 108
- 1706 Northfield Square Unit D
- 1045 Woodlawn Rd
- 3 Robin Hood Ln
- 276 Crestwood Village
- 1050 Burton Terrace
- 238 W Frontage Rd
- 4072 Bunker Ln
- 1410 Tuscany Ct
- 175 Lagoon Dr
- 1414 Canterbury Ln
- 332 Regent Wood Rd Unit 332
- 46 Meadowood Ln
- 30 Meadowood Ln
- 759 Fairhope Ave
- 760 Fairhope Ave
- 26 Meadowood Ln
- 60 Meadowood Ln
- 60 Meadowood Ln
- 801 Fairhope Ave
- 50 Meadowood Ln
- 800 Fairhope Ave
- 59 Meadowood Ln
- 25 Meadowood Ln
- 805 Fairhope Ave
- 810 Fairhope Ave
- 1970 Winnetka Ave
- 6 Bridlewood Ln
- 20 Meadowood Ln
- 20 Meadowood Ln
- 815 Fairhope Ave
- 95 Meadowood Ln
Your Personal Tour Guide
Ask me questions while you tour the home.