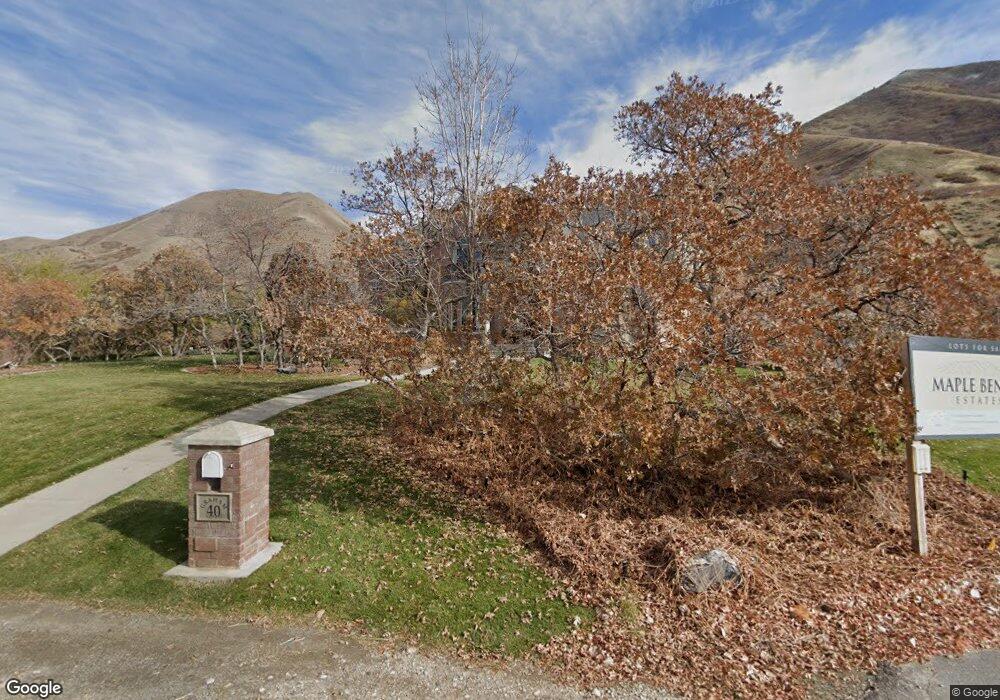
40 N 1900 E Mapleton, UT 84664
Estimated Value: $1,715,171 - $2,966,000
4
Beds
8
Baths
4,845
Sq Ft
$492/Sq Ft
Est. Value
About This Home
This home is located at 40 N 1900 E, Mapleton, UT 84664 and is currently estimated at $2,384,724, approximately $492 per square foot. 40 N 1900 E is a home located in Utah County with nearby schools including Mapleton School, Mapleton Junior High School, and Maple Mountain High School.
Ownership History
Date
Name
Owned For
Owner Type
Purchase Details
Closed on
Feb 7, 2022
Sold by
Graham Randal S and Graham Lily
Bought by
Lily Christine Graham Living Trust
Current Estimated Value
Home Financials for this Owner
Home Financials are based on the most recent Mortgage that was taken out on this home.
Original Mortgage
$647,000
Outstanding Balance
$600,861
Interest Rate
3.56%
Mortgage Type
New Conventional
Estimated Equity
$1,783,863
Purchase Details
Closed on
Nov 20, 2013
Sold by
Graham Lily Christine and Lily Christine Graham Trust
Bought by
Graham Randal S and Graham Lily C
Home Financials for this Owner
Home Financials are based on the most recent Mortgage that was taken out on this home.
Original Mortgage
$402,500
Interest Rate
4.18%
Mortgage Type
New Conventional
Purchase Details
Closed on
Nov 28, 2003
Sold by
Graham Randal S and Graham Lily C
Bought by
Graham Lily Christine and Lily Christine Graham Trust
Create a Home Valuation Report for This Property
The Home Valuation Report is an in-depth analysis detailing your home's value as well as a comparison with similar homes in the area
Home Values in the Area
Average Home Value in this Area
Purchase History
| Date | Buyer | Sale Price | Title Company |
|---|---|---|---|
| Lily Christine Graham Living Trust | -- | Old Republic Title | |
| Graham Randal S | -- | Old Republic Title | |
| Graham Randal S | -- | First American Title Co Llc | |
| Graham Lily Christine | -- | -- |
Source: Public Records
Mortgage History
| Date | Status | Borrower | Loan Amount |
|---|---|---|---|
| Open | Graham Randal S | $647,000 | |
| Previous Owner | Graham Randal S | $402,500 |
Source: Public Records
Tax History
| Year | Tax Paid | Tax Assessment Tax Assessment Total Assessment is a certain percentage of the fair market value that is determined by local assessors to be the total taxable value of land and additions on the property. | Land | Improvement |
|---|---|---|---|---|
| 2025 | $9,092 | $1,028,225 | -- | -- |
| 2024 | $9,092 | $890,625 | $0 | $0 |
| 2023 | $9,005 | $887,720 | $0 | $0 |
| 2022 | $8,621 | $1,410,900 | $461,100 | $949,800 |
| 2021 | $7,600 | $1,043,800 | $313,200 | $730,600 |
| 2020 | $7,511 | $1,006,000 | $275,400 | $730,600 |
| 2019 | $7,518 | $1,029,500 | $269,400 | $760,100 |
| 2018 | $7,224 | $1,028,600 | $220,800 | $807,800 |
| 2017 | $8,224 | $613,930 | $0 | $0 |
| 2016 | $7,944 | $589,525 | $0 | $0 |
Source: Public Records
Map
Nearby Homes
- 149 S Krissa St Unit 10
- 234 S Krissa St Unit 1
- 266 S Krissa St Unit 2
- 304 S Krissa St Unit 3
- 204 S Troy St
- 1515 E Maple St
- 630 N 1600 E
- 702 N 2000 E Unit 305
- 575 S 1560 E
- 764 N 2000 E
- 1759 S Perry Dr
- 4021 S Ironwood Ln Unit 428
- 4886 S Englemann Ln Unit 525
- 2254 715 S Unit 60
- 4013 S Ironwood Ln Unit 432
- 4014 S Ironwood Ln
- 4001 S Ironwood Ln Unit 438
- 2254 715 S
- 4012 S Ironwood Ln Unit 424
- 2042 715 S Unit 57
- 1882 E Maple St
- 1882 E Maple St Unit 2
- 1882 E Maple St Unit 1
- 1882 E Maple St Unit TWO
- 1881 E Maple St
- 119 N Clegg Canyon Dr
- 130 N 1900 E
- 1824 E Maple St
- 1824 E Maple St Unit 1
- 1824 E Maple St Unit ONE
- 98 N 1800 E
- 167 N Clegg Canyon Dr
- 226 N 1900 E
- 35 N 1800 E
- 210 N 1800 E
- 216 N 1800 E
- 145 N 1800 E
- 1690 E Maple St
- 94 S Conrad St
- 276 N Clegg Canyon Dr
Your Personal Tour Guide
Ask me questions while you tour the home.