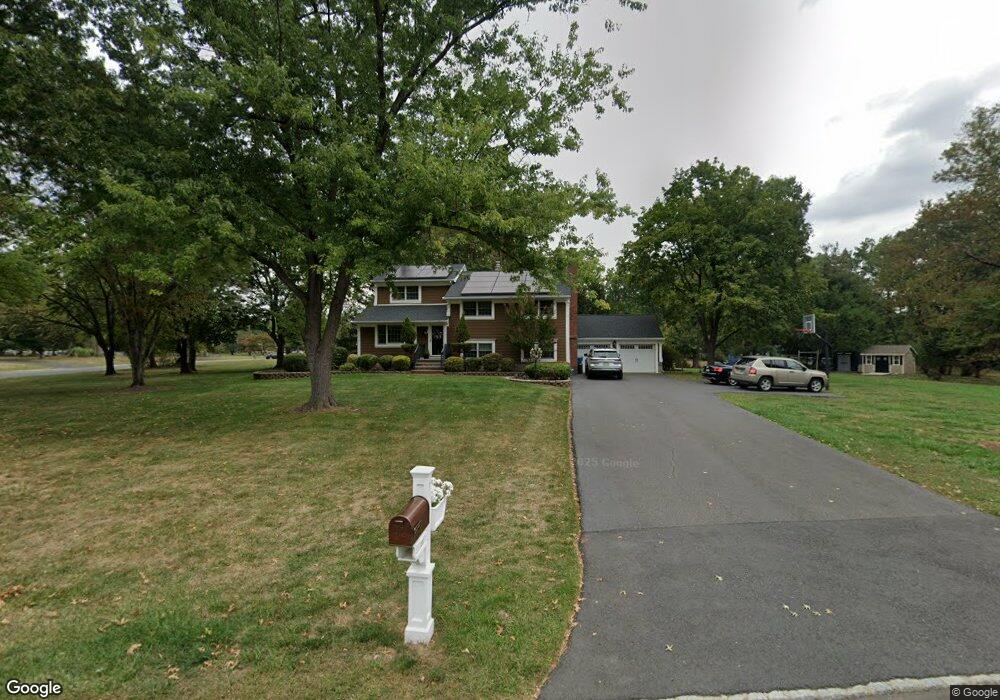
400 2nd Ave Piscataway, NJ 08854
Estimated Value: $724,539 - $796,000
Studio
--
Bath
2,128
Sq Ft
$359/Sq Ft
Est. Value
About This Home
This home is located at 400 2nd Ave, Piscataway, NJ 08854 and is currently estimated at $764,385, approximately $359 per square foot. 400 2nd Ave is a home located in Middlesex County with nearby schools including Martin Luther King Intermediate School, Randolphville Elementary School, and Conackamack Middle School.
Ownership History
Date
Name
Owned For
Owner Type
Purchase Details
Closed on
Mar 9, 2001
Sold by
Lenihan Michael
Bought by
Parra Harold and Parra Dawn
Current Estimated Value
Home Financials for this Owner
Home Financials are based on the most recent Mortgage that was taken out on this home.
Original Mortgage
$225,000
Outstanding Balance
$76,707
Interest Rate
7.01%
Estimated Equity
$687,678
Purchase Details
Closed on
Sep 28, 2000
Create a Home Valuation Report for This Property
The Home Valuation Report is an in-depth analysis detailing your home's value as well as a comparison with similar homes in the area
Home Values in the Area
Average Home Value in this Area
Purchase History
| Date | Buyer | Sale Price | Title Company |
|---|---|---|---|
| Parra Harold | $296,000 | -- | |
| -- | $296,000 | -- |
Source: Public Records
Mortgage History
| Date | Status | Borrower | Loan Amount |
|---|---|---|---|
| Open | Parra Harold | $225,000 |
Source: Public Records
Tax History
| Year | Tax Paid | Tax Assessment Tax Assessment Total Assessment is a certain percentage of the fair market value that is determined by local assessors to be the total taxable value of land and additions on the property. | Land | Improvement |
|---|---|---|---|---|
| 2025 | $11,010 | $626,200 | $374,800 | $251,400 |
| 2024 | $11,100 | $562,600 | $241,800 | $320,800 |
| 2023 | $11,100 | $531,100 | $241,800 | $289,300 |
| 2022 | $10,616 | $471,400 | $241,800 | $229,600 |
| 2021 | $10,007 | $427,300 | $221,800 | $205,500 |
| 2020 | $9,673 | $414,100 | $221,800 | $192,300 |
| 2019 | $9,906 | $416,900 | $221,800 | $195,100 |
| 2018 | $9,618 | $405,500 | $221,800 | $183,700 |
| 2017 | $9,925 | $362,100 | $186,800 | $175,300 |
| 2016 | $9,740 | $362,100 | $186,800 | $175,300 |
| 2015 | $9,603 | $362,100 | $186,800 | $175,300 |
| 2014 | $9,386 | $362,100 | $186,800 | $175,300 |
Source: Public Records
Map
Nearby Homes
- 431 Brentwood Dr
- 51 Cherrywood Dr
- 19 Cherrywood Dr
- 165 Normandy Dr
- 160 Stratton St S
- 7 3rd Ave
- 5 Cherrywood Dr
- 9 Lavender Dr
- 2250 Plainfield Ave N
- 270 Pinelli Dr Unit 270
- 308 Bound Brook Ave
- 2401 Cooper St
- 206 Pinelli Dr
- 327 Moonlight Dr
- 704 Plainfield Ave
- 2603 Wade St
- 15 Barbour Place
- 43 Forest Dr
- 37 Forest Dr
- 40 Forest Dr
Your Personal Tour Guide
Ask me questions while you tour the home.