400 Cherry St Belmont, NC 28012
Estimated Value: $227,000 - $264,933
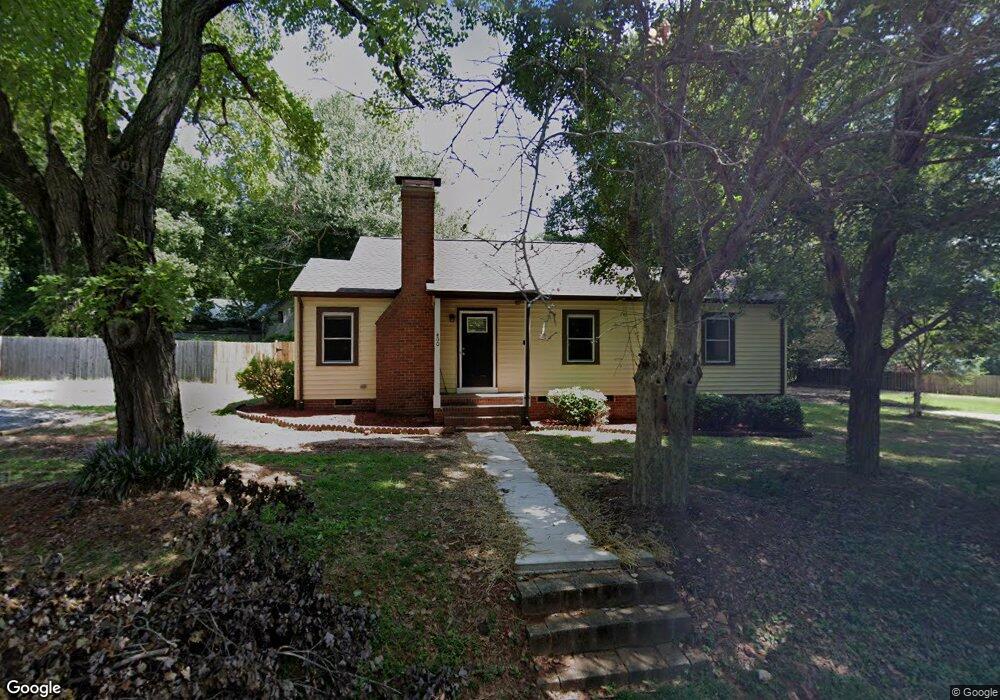
About This Home
This home is located at 400 Cherry St, Belmont, NC 28012 and is currently estimated at $251,483, approximately $222 per square foot. 400 Cherry St is a home located in Gaston County with nearby schools including Catawba Heights Elementary School, Mount Holly Middle School, and South Point High School.
Ownership History
We collect this data history from publicly available records. To have your information removed, we recommend requesting removal directly through your county’s website.
Purchase Details
Purchase Details
Home Financials for this Owner
Home Financials are based on the most recent Mortgage that was taken out on this home.Purchase Details
Home Financials for this Owner
Home Financials are based on the most recent Mortgage that was taken out on this home.Purchase Details
Home Financials for this Owner
Home Financials are based on the most recent Mortgage that was taken out on this home.Purchase History
We collect this data history from publicly available records. To have your information removed, we recommend requesting removal directly through your county’s website.
| Date | Buyer | Sale Price | Title Company |
|---|---|---|---|
| $225,000 | Chicago Title Insurance Co | ||
| $225,000 | Chicago Title | ||
| $96,000 | Chicago Title Company Llc | ||
| $73,000 | -- | ||
| $68,500 | -- |
Mortgage History
We collect this data history from publicly available records. To have your information removed, we recommend requesting removal directly through your county’s website.
| Date | Status | Borrower | Loan Amount |
|---|---|---|---|
| Previous Owner | $172,000 | ||
| Previous Owner | $71,659 | ||
| Previous Owner | $66,400 |
Tax History
We collect this data history from publicly available records. To have your information removed, we recommend requesting removal directly through your county’s website.
| Year | Tax Paid | Tax Assessment Tax Assessment Total Assessment is a certain percentage of the fair market value that is determined by local assessors to be the total taxable value of land and additions on the property. | Land | Improvement |
|---|---|---|---|---|
| 2025 | $2,023 | $201,490 | $25,000 | $176,490 |
| 2024 | $2,023 | $201,490 | $25,000 | $176,490 |
| 2023 | $2,045 | $201,490 | $25,000 | $176,490 |
| 2022 | $1,395 | $107,690 | $16,500 | $91,190 |
| 2021 | $1,275 | $96,940 | $16,500 | $80,440 |
| 2019 | $1,284 | $96,940 | $16,500 | $80,440 |
| 2018 | $1,071 | $76,487 | $14,400 | $62,087 |
| 2017 | $1,071 | $76,487 | $14,400 | $62,087 |
| 2016 | $665 | $76,487 | $0 | $0 |
| 2014 | $569 | $65,371 | $18,000 | $47,371 |
Map
- 219 Belton Ave
- 214 Brookwood Rd
- 107 Rose St
- 5016 Clearwater Lake Rd
- 405 Belmont Mount Holly Rd
- 711 Tuckaseege Rd
- 107 Oakland Rd
- 221 Auten Cir
- 116 Abel Peterson Dr
- 305 E Henry St
- 206 E Catawba Dr
- 123 Coral Rutledge Dr
- 311 Beatty Dr
- 113 Pleasant St
- 115 Odaniel St
- 58 Burton St
- 5235 Clearwater Lake Rd
- 143 Oak Trail
- 2301 Acme Rd
- 814 S Main St
Ask me questions while you tour the home.