Estimated Value: $640,000 - $924,437
About This Home
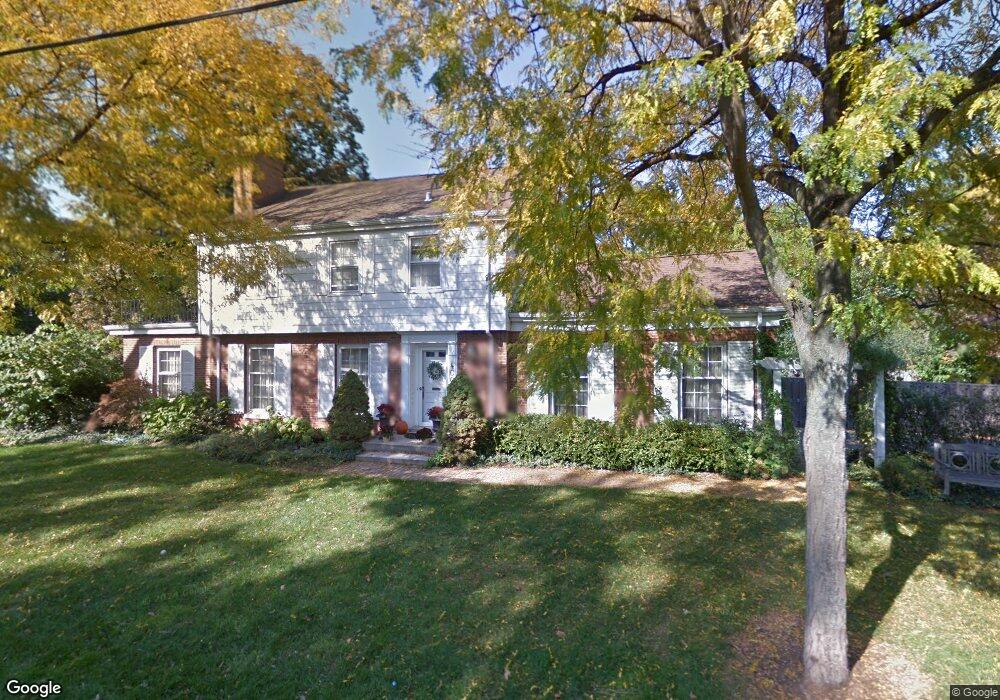
This home is located at 400 E Park St, Arlington Heights, IL 60005 and is currently estimated at $827,859, approximately $313 per square foot. 400 E Park St is a home located in Cook County with nearby schools including Dryden Elementary School, South Middle School, and Prospect High School.
Ownership History
We collect this data history from publicly available records. To have your information removed, we recommend requesting removal directly through your county’s website.
Purchase Details
Home Financials for this Owner
Home Financials are based on the most recent Mortgage that was taken out on this home.Purchase Details
Home Financials for this Owner
Home Financials are based on the most recent Mortgage that was taken out on this home.Purchase Details
Home Values in the Area
Average Home Value in this Area
Purchase History
We collect this data history from publicly available records. To have your information removed, we recommend requesting removal directly through your county’s website.
| Date | Buyer | Sale Price | Title Company |
|---|---|---|---|
| $565,000 | None Listed On Document | ||
| -- | -- | ||
| -- | -- |
Mortgage History
We collect this data history from publicly available records. To have your information removed, we recommend requesting removal directly through your county’s website.
| Date | Status | Borrower | Loan Amount |
|---|---|---|---|
| Open | $536,750 | ||
| Previous Owner | $200,000 |
Tax History
We collect this data history from publicly available records. To have your information removed, we recommend requesting removal directly through your county’s website.
| Year | Tax Paid | Tax Assessment Tax Assessment Total Assessment is a certain percentage of the fair market value that is determined by local assessors to be the total taxable value of land and additions on the property. | Land | Improvement |
|---|---|---|---|---|
| 2025 | $17,708 | $70,000 | $17,760 | $52,240 |
| 2024 | $17,708 | $63,871 | $16,650 | $47,221 |
| 2023 | $17,027 | $68,000 | $16,650 | $51,350 |
| 2022 | $17,027 | $68,000 | $16,650 | $51,350 |
| 2021 | $14,006 | $49,860 | $9,157 | $40,703 |
| 2020 | $13,711 | $49,860 | $9,157 | $40,703 |
| 2019 | $13,694 | $55,586 | $9,157 | $46,429 |
| 2018 | $12,228 | $45,338 | $8,047 | $37,291 |
| 2017 | $12,543 | $46,870 | $8,047 | $38,823 |
| 2016 | $11,935 | $46,870 | $8,047 | $38,823 |
| 2015 | $12,594 | $45,276 | $6,937 | $38,339 |
| 2014 | $12,242 | $45,276 | $6,937 | $38,339 |
| 2013 | $11,917 | $45,276 | $6,937 | $38,339 |
Map
- 407 S Pine Ave
- 512 S Bristol Ln
- 434 S Beverly Ln
- 630 S Beverly Ln
- 530 S Dryden Place
- 110 S Dunton Ave Unit 2A
- 77 S Evergreen Ave Unit 206
- 77 S Evergreen Ave Unit 806
- 77 S Evergreen Ave Unit 402
- 24 N Belmont Ave
- 909 E Rockwell St
- 435 S Cleveland Ave Unit 307
- 505 S Cleveland Ave Unit 106
- 808 E Wing St
- 33 N Lincoln Ln
- 819 S Beverly Ln
- 214 W Sigwalt St
- 535 S Cleveland Ave Unit 406
- 304 S Mitchell Ave
- 116 N Pine Ave
- 412 S Banbury Rd
- 408 S Banbury Rd
- 418 S Banbury Rd
- 425 S Belmont Ave
- 415 S Belmont Ave
- 433 S Belmont Ave
- 424 S Banbury Rd
- 437 S Belmont Ave
- 423 S Banbury Rd
- 417 S Banbury Rd
- 415 S Banbury Rd
- 429 S Banbury Rd
- 429 S Banbury Rd
- 441 S Belmont Ave
- 416 E Park St
- 409 S Banbury Rd
- 420 S Belmont Ave
- 428 S Belmont Ave
- 433 S Banbury Rd
- 416 S Belmont Ave
Ask me questions while you tour the home.