400 W Benson St Cincinnati, OH 45215
About This Home
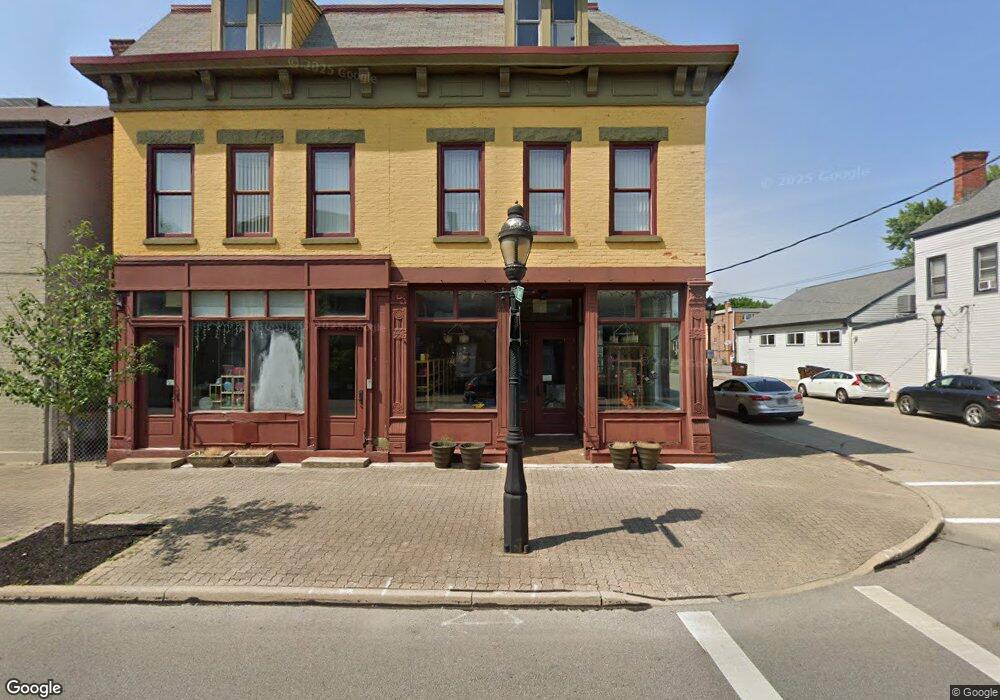
This home is located at 400 W Benson St, Cincinnati, OH 45215. 400 W Benson St is a home located in Hamilton County with nearby schools including Reading Community High School, Saints Peter and Paul Academy, and Mount Notre Dame High School.
Ownership History
We collect this data history from publicly available records. To have your information removed, we recommend requesting removal directly through your county’s website.
Purchase Details
Purchase Details
Purchase Details
Purchase Details
Home Values in the Area
Average Home Value in this Area
Purchase History
We collect this data history from publicly available records. To have your information removed, we recommend requesting removal directly through your county’s website.
| Date | Buyer | Sale Price | Title Company |
|---|---|---|---|
| -- | None Listed On Document | ||
| $140,000 | None Available | ||
| -- | None Available | ||
| -- | -- |
Tax History
We collect this data history from publicly available records. To have your information removed, we recommend requesting removal directly through your county’s website.
| Year | Tax Paid | Tax Assessment Tax Assessment Total Assessment is a certain percentage of the fair market value that is determined by local assessors to be the total taxable value of land and additions on the property. | Land | Improvement |
|---|---|---|---|---|
| 2025 | $6,083 | $72,797 | $14,126 | $58,671 |
| 2023 | $6,081 | $72,797 | $14,126 | $58,671 |
| 2022 | $6,366 | $65,625 | $13,405 | $52,220 |
| 2021 | $5,729 | $65,625 | $13,405 | $52,220 |
| 2020 | $5,675 | $65,625 | $13,405 | $52,220 |
| 2019 | $5,889 | $63,711 | $13,013 | $50,698 |
| 2018 | $5,909 | $63,711 | $13,013 | $50,698 |
| 2017 | $5,757 | $63,711 | $13,013 | $50,698 |
| 2016 | $5,658 | $62,465 | $12,166 | $50,299 |
| 2015 | $5,620 | $62,465 | $12,166 | $50,299 |
| 2014 | $5,127 | $62,465 | $12,166 | $50,299 |
| 2013 | $5,152 | $63,739 | $12,415 | $51,324 |
Map
- 806 Wachendorf St
- 435 Pearl St
- 4111 North St
- 311 W Vine St
- 243 W Vine St
- 228 Central Ave
- 329 Walnut St
- 116 Pike St
- 231 Walnut St
- 539 Jefferson Ave
- 321 Southern Ave
- 1421 Jefferson Ave
- 654 3rd St
- 1423 Market St
- 406 Williams St
- 8627 Reading Rd
- 221 E Mechanic St
- 112 Bacon St
- 668 Elliott Ave
- 0 Hill St Unit 1616370
- 336 W Benson St
- 409 Pike St
- 337 W Benson St
- 411 Pike St
- 341 W Benson St
- 418 W Benson St
- 418 W Benson St Unit 420
- 333 W Benson St
- 415 Pike St
- 415 W Benson St
- 420 W Benson St
- 419 Pike St
- 321 Pike St
- 325 W Benson St
- 419 W Benson St
- 320 W Benson St
- 423 Pike St
- 317 Pike St
- 323 W Benson St
- 400 Pike St Unit 601
Ask me questions while you tour the home.