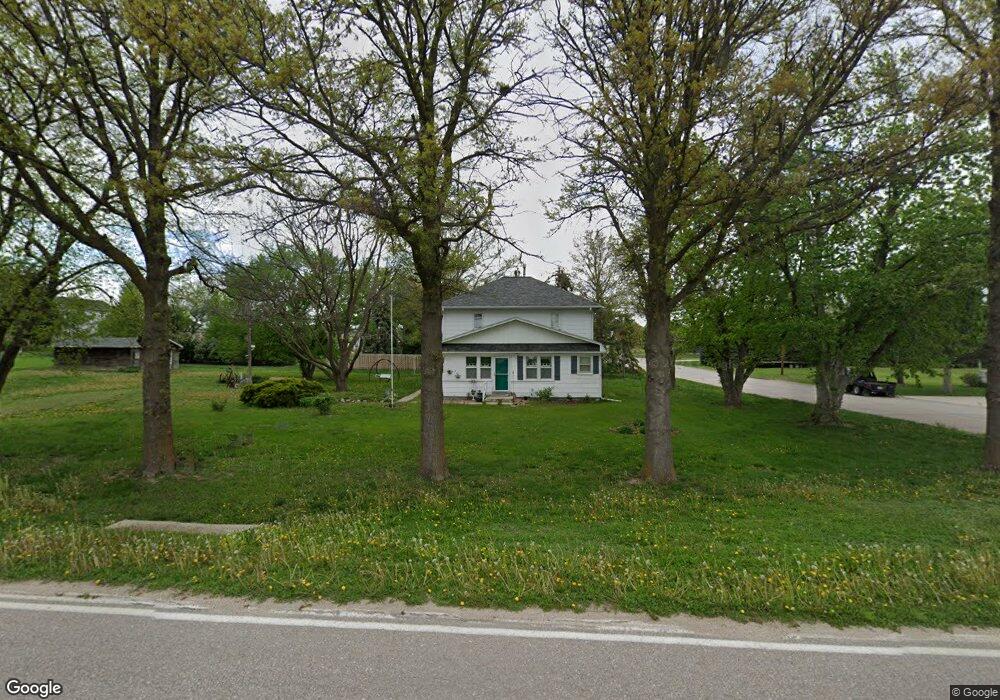
400 W O St Mc Cool Junction, NE 68401
Estimated Value: $128,000 - $389,112
About This Home
This home is located at 400 W O St, Mc Cool Junction, NE 68401 and is currently estimated at $256,528, approximately $214 per square foot. 400 W O St is a home located in York County with nearby schools including McCool Junction Elementary School and McCool Junction Junior/Senior High School.
Ownership History
We collect this data history from publicly available records. To have your information removed, we recommend requesting removal directly through your county’s website.
Purchase Details
Purchase Details
Home Financials for this Owner
Home Financials are based on the most recent Mortgage that was taken out on this home.Purchase Details
Purchase History
We collect this data history from publicly available records. To have your information removed, we recommend requesting removal directly through your county’s website.
| Date | Buyer | Sale Price | Title Company |
|---|---|---|---|
| -- | None Listed On Document | ||
| -- | -- | ||
| -- | -- |
Mortgage History
We collect this data history from publicly available records. To have your information removed, we recommend requesting removal directly through your county’s website.
| Date | Status | Borrower | Loan Amount |
|---|---|---|---|
| Previous Owner | $25,000 |
Tax History
We collect this data history from publicly available records. To have your information removed, we recommend requesting removal directly through your county’s website.
| Year | Tax Paid | Tax Assessment Tax Assessment Total Assessment is a certain percentage of the fair market value that is determined by local assessors to be the total taxable value of land and additions on the property. | Land | Improvement |
|---|---|---|---|---|
| 2025 | $1,131 | $331,915 | $50,594 | $281,321 |
| 2024 | $1,244 | $90,028 | $4,200 | $85,828 |
| 2023 | $1,312 | $90,028 | $4,200 | $85,828 |
| 2022 | $1,058 | $73,320 | $4,200 | $69,120 |
| 2021 | $751 | $50,451 | $4,200 | $46,251 |
| 2020 | $747 | $46,705 | $4,200 | $42,505 |
| 2019 | $876 | $46,705 | $4,200 | $42,505 |
| 2018 | $868 | $45,515 | $4,200 | $41,315 |
| 2017 | $849 | $46,961 | $4,200 | $42,761 |
| 2016 | -- | $44,343 | $3,670 | $40,673 |
| 2015 | -- | $42,968 | $3,670 | $39,298 |
| 2014 | -- | $42,968 | $3,670 | $39,298 |
Map
- 203 S 3rd Ave
- LOT 5 Blk 2 St
- LOT 6 Blk 3 St
- LOT 5 Blk 3 St
- LOT 4 Blk 3 St
- Lot 2 Blk 3 St
- Lot 10 Blk 1 St
- Lot 4 Blk 2 St
- Lot 1 Blk 2 St
- LOT 2 Blk 2 St
- LOT 9 Blk 1 St
- LOT 1 Blk 1 3rd Add St
- Lot 3 Blk 2 St
- 300 Jo Ln
- Lot 8 Blk 1 St
- Lot 4 Blk 1 St
- LOT 5 Blk 1 St
- LOT 7 Blk 1 St
- Lot 6 Blk 1 St
- 128 N 5th St
Ask me questions while you tour the home.