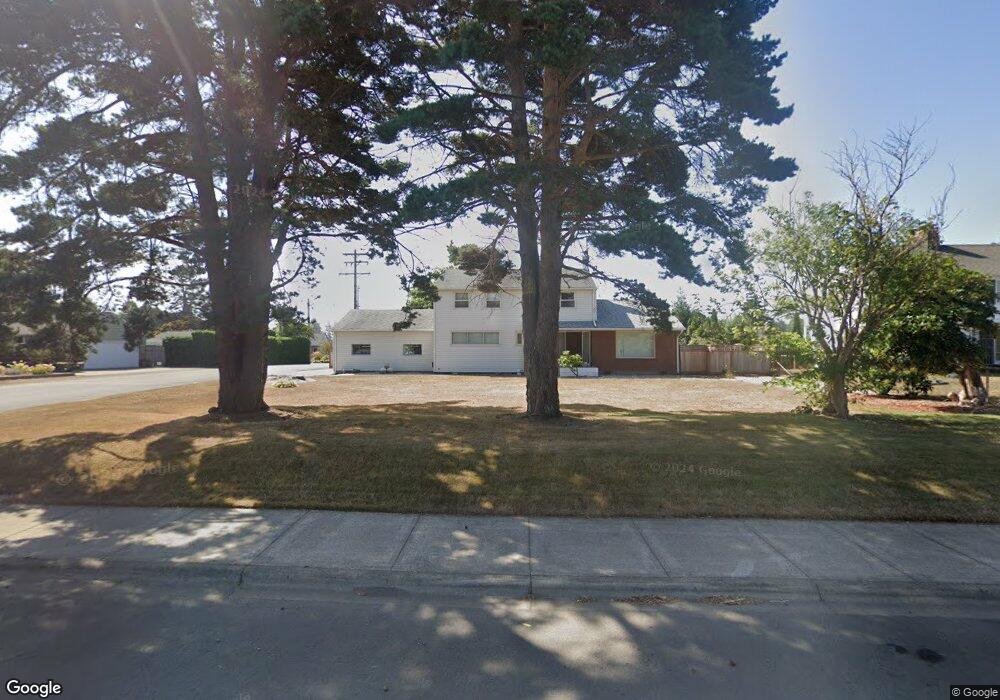
4011 3rd St Tillamook, OR 97141
Estimated Value: $350,000 - $495,000
4
Beds
2
Baths
2,133
Sq Ft
$188/Sq Ft
Est. Value
About This Home
This home is located at 4011 3rd St, Tillamook, OR 97141 and is currently estimated at $400,378, approximately $187 per square foot. 4011 3rd St is a home located in Tillamook County with nearby schools including Tillamook High School, Tillamook Adventist School, and Pacific Christian School.
Ownership History
Date
Name
Owned For
Owner Type
Purchase Details
Closed on
Dec 21, 2021
Sold by
Brennan John R and Brennan Joanne L
Bought by
Bertrand Brian L and Bertrand Kristi L
Current Estimated Value
Home Financials for this Owner
Home Financials are based on the most recent Mortgage that was taken out on this home.
Original Mortgage
$200,000
Outstanding Balance
$182,836
Interest Rate
3.12%
Mortgage Type
Purchase Money Mortgage
Estimated Equity
$217,542
Purchase Details
Closed on
Oct 9, 2018
Sold by
Brennan John R and Brennan Joanne L
Bought by
Brennan John R and Brennan Joanne L
Create a Home Valuation Report for This Property
The Home Valuation Report is an in-depth analysis detailing your home's value as well as a comparison with similar homes in the area
Home Values in the Area
Average Home Value in this Area
Purchase History
| Date | Buyer | Sale Price | Title Company |
|---|---|---|---|
| Bertrand Brian L | $260,000 | Ticor Title | |
| Brennan John R | -- | None Available |
Source: Public Records
Mortgage History
| Date | Status | Borrower | Loan Amount |
|---|---|---|---|
| Open | Bertrand Brian L | $200,000 |
Source: Public Records
Tax History
| Year | Tax Paid | Tax Assessment Tax Assessment Total Assessment is a certain percentage of the fair market value that is determined by local assessors to be the total taxable value of land and additions on the property. | Land | Improvement |
|---|---|---|---|---|
| 2025 | $3,125 | $259,990 | $103,700 | $156,290 |
| 2024 | $2,969 | $252,420 | $100,680 | $151,740 |
| 2023 | $2,941 | $245,070 | $97,740 | $147,330 |
| 2022 | $2,841 | $237,940 | $94,890 | $143,050 |
| 2021 | $2,756 | $231,010 | $92,130 | $138,880 |
| 2020 | $2,681 | $224,290 | $89,450 | $134,840 |
| 2019 | $2,612 | $217,760 | $86,850 | $130,910 |
| 2018 | $2,545 | $211,420 | $84,320 | $127,100 |
| 2017 | $2,446 | $205,270 | $81,860 | $123,410 |
| 2016 | $2,285 | $199,300 | $79,480 | $119,820 |
| 2015 | $2,236 | $193,210 | $79,480 | $113,730 |
| 2014 | $2,100 | $179,040 | $76,110 | $102,930 |
| 2013 | -- | $184,600 | $79,480 | $105,120 |
Source: Public Records
Map
Nearby Homes
- 4204 Dogwood Ave
- 4005 Elmwood St
- 509 Williams Ave
- 1110 Meadow Ave
- V/L Marolf Loop Rd
- 508 Linden Dr
- 3413 Maple Ln
- 3810 3rd St
- 409 Del Monte Ave
- TL#02600 12th St
- 00 Schild Rd Unit 201
- 00 Schild Rd
- 411 Park Ave
- 2505 1st St
- 2506 1st St
- 2418 1st St
- 2410 3rd St
- Parcel 1 Wilson River Hwy
- Parcel 2 Wilson River Hwy
- TL# 02100 Wilson River Hwy
Your Personal Tour Guide
Ask me questions while you tour the home.