Estimated Value: $303,171 - $441,000
Studio
--
Bath
1,982
Sq Ft
$174/Sq Ft
Est. Value
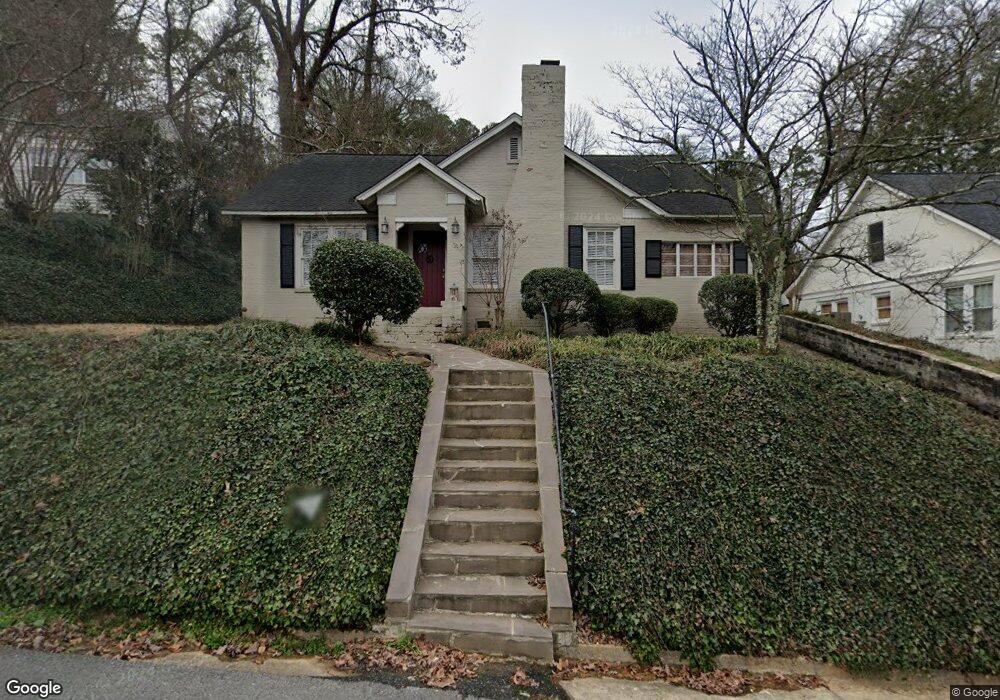
About This Home
This home is located at 402 E 11th St SE, Rome, GA 30161 and is currently estimated at $344,793, approximately $173 per square foot. 402 E 11th St SE is a home located in Floyd County with nearby schools including Rome High School, St. Mary School, and Darlington School.
Ownership History
Date
Name
Owned For
Owner Type
Purchase Details
Closed on
Mar 20, 2007
Sold by
Not Provided
Bought by
Willingham Leonard C and Willingham Martha S
Current Estimated Value
Home Financials for this Owner
Home Financials are based on the most recent Mortgage that was taken out on this home.
Original Mortgage
$175,000
Interest Rate
6.01%
Mortgage Type
New Conventional
Purchase Details
Closed on
Mar 16, 2007
Sold by
Not Provided
Bought by
Willingham Leonard C and Willingham Martha S
Home Financials for this Owner
Home Financials are based on the most recent Mortgage that was taken out on this home.
Original Mortgage
$175,000
Interest Rate
6.01%
Mortgage Type
New Conventional
Purchase Details
Closed on
Mar 2, 2007
Sold by
Not Provided
Bought by
Willingham Leonard C and Willingham Martha S
Home Financials for this Owner
Home Financials are based on the most recent Mortgage that was taken out on this home.
Original Mortgage
$175,000
Interest Rate
6.01%
Mortgage Type
New Conventional
Purchase Details
Closed on
Oct 1, 2001
Sold by
Wall Marc O
Bought by
Wade Roger
Purchase Details
Closed on
Jan 31, 2001
Bought by
P and R
Purchase Details
Closed on
Jun 27, 1995
Bought by
Gavant Susan Irma
Create a Home Valuation Report for This Property
The Home Valuation Report is an in-depth analysis detailing your home's value as well as a comparison with similar homes in the area
Home Values in the Area
Average Home Value in this Area
Purchase History
We collect this data history from publicly available records. To have your information removed, we recommend requesting removal directly through your county’s website.
| Date | Buyer | Sale Price | Title Company |
|---|---|---|---|
| Willingham Leonard C | -- | -- | |
| Willingham Leonard C | $190,000 | -- | |
| Willingham Leonard C | -- | -- | |
| Wade Roger | $80,000 | -- | |
| P | -- | -- | |
| Wall Marc O | -- | -- | |
| Gavant Susan Irma | -- | -- |
Source: Public Records
Mortgage History
We collect this data history from publicly available records. To have your information removed, we recommend requesting removal directly through your county’s website.
| Date | Status | Borrower | Loan Amount |
|---|---|---|---|
| Closed | Willingham Leonard C | $175,000 | |
| Closed | Willingham Leonard C | $175,000 |
Source: Public Records
Tax History
| Year | Tax Paid | Tax Assessment Tax Assessment Total Assessment is a certain percentage of the fair market value that is determined by local assessors to be the total taxable value of land and additions on the property. | Land | Improvement |
|---|---|---|---|---|
| 2025 | $2,511 | $122,411 | $14,133 | $108,278 |
| 2024 | $2,511 | $113,988 | $12,848 | $101,140 |
| 2023 | $2,343 | $106,540 | $11,680 | $94,860 |
| 2022 | $2,123 | $88,488 | $9,636 | $78,852 |
| 2021 | $2,017 | $80,590 | $9,636 | $70,954 |
| 2020 | $1,938 | $74,842 | $7,300 | $67,542 |
| 2019 | $2,546 | $71,208 | $7,300 | $63,908 |
| 2018 | $2,452 | $67,527 | $7,300 | $60,227 |
| 2017 | $2,299 | $63,391 | $7,300 | $56,091 |
| 2016 | $2,268 | $62,372 | $7,280 | $55,092 |
| 2015 | $2,238 | $59,772 | $7,280 | $52,492 |
| 2014 | $2,238 | $65,068 | $7,280 | $57,788 |
Source: Public Records
Map
Nearby Homes
- 9 Richland Ct SE
- 15 Lenox Cir SE
- 0 Turnbull Dr SE Unit 10570009
- 4 Townview Rd SE
- 3 Briarcliff Rd SE
- 12 Turnbull Dr SE
- 153 Vinings Ct SE
- 513 E 11th St SE
- 7 Crestview Ln SE
- 415 E 10th St SE
- 20 Riverview Rd SE
- 1312 E 2nd Ave SE
- 1314 E 2nd Ave SE
- 1407 E 2nd Ave SE
- 5 Kentucky Ave SE
- 209 Moultrie Ln SE
- 217 E 10th St SW
- 9 Eastridge Ct SW
- 809 E 2nd Ave SW
- 201 E 10th St SW
- 404 E 11th St SE
- 404 SE E 11th St
- 400 E 11th St SE
- 1101 Collinwood Rd SE
- 11 E 11th St SE
- 406 E 11th St SE
- 1103 Collinwood Rd SE
- 405 E 11th St SE
- 405 E 11th St SE
- 405 E 11th St SE
- 405 E 11th St SE Unit J14I099
- 403 E 11th St SE
- 401 E 11th St SE
- 410 E 11th St SE
- 1 Vassar Dr SE
- 407 E 11th St SE
- 5 Lenox Cir SE
- 1105 Collinwood Rd SE
- 3 Vassar Dr SE
- 331 E 11th St SE
Your Personal Tour Guide
Ask me questions while you tour the home.