402 E Main St Hogansville, GA 30230
Hogansville AreaEstimated Value: $203,160
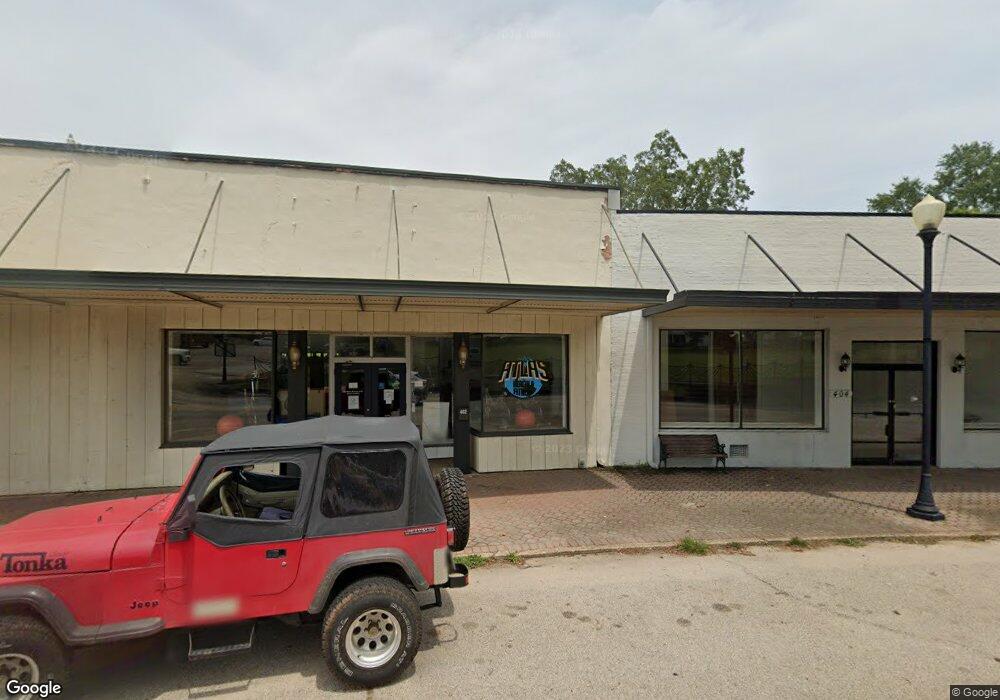
About This Home
This home is located at 402 E Main St, Hogansville, GA 30230 and is currently estimated at $203,160, approximately $51 per square foot. 402 E Main St is a home located in Troup County with nearby schools including Hogansville Elementary School, Callaway Elementary School, and Callaway Middle School.
Ownership History
We collect this data history from publicly available records. To have your information removed, we recommend requesting removal directly through your county’s website.
Purchase Details
Purchase Details
Purchase Details
Purchase Details
Purchase Details
Home Values in the Area
Average Home Value in this Area
Purchase History
We collect this data history from publicly available records. To have your information removed, we recommend requesting removal directly through your county’s website.
| Date | Buyer | Sale Price | Title Company |
|---|---|---|---|
| $120,000 | -- | ||
| $55,500 | -- | ||
| -- | -- | ||
| -- | -- | ||
| -- | -- |
Tax History
We collect this data history from publicly available records. To have your information removed, we recommend requesting removal directly through your county’s website.
| Year | Tax Paid | Tax Assessment Tax Assessment Total Assessment is a certain percentage of the fair market value that is determined by local assessors to be the total taxable value of land and additions on the property. | Land | Improvement |
|---|---|---|---|---|
| 2025 | $3,951 | $112,160 | $7,600 | $104,560 |
| 2024 | $3,951 | $112,160 | $7,600 | $104,560 |
| 2023 | $2,895 | $82,200 | $7,600 | $74,600 |
| 2022 | $2,771 | $90,920 | $7,600 | $83,320 |
| 2021 | $1,976 | $51,840 | $7,600 | $44,240 |
| 2020 | $1,976 | $51,840 | $7,600 | $44,240 |
| 2019 | $1,829 | $48,840 | $5,680 | $43,160 |
| 2018 | $931 | $24,440 | $5,680 | $18,760 |
| 2017 | $931 | $24,440 | $5,680 | $18,760 |
| 2016 | $1,015 | $24,562 | $5,714 | $18,848 |
| 2015 | $946 | $29,170 | $7,618 | $21,552 |
| 2014 | $1,029 | $29,170 | $7,618 | $21,552 |
| 2013 | -- | $31,672 | $5,680 | $25,992 |
Map
- 0 Hightower Rd Unit LOT 1B
- 0 Hightower Rd Unit LOT 1A
- 102 Johnson St
- 107 High St
- 201 Oak St
- 205 Tj's Trail
- 214 Tj's Trail
- 200 Tj's Trail
- 212 Tj's Trail
- 211 Tj's Trail
- 216 Tj's Trail
- 218 Tj's Trail
- 210 Tj's Trail
- 209 Tj's Trail
- 201 Tj's Trail
- 203 Tj's Trail
- 605 E Main St
- 214 Johnson St
- 117 Ware St
- 221 Johnson St
Ask me questions while you tour the home.