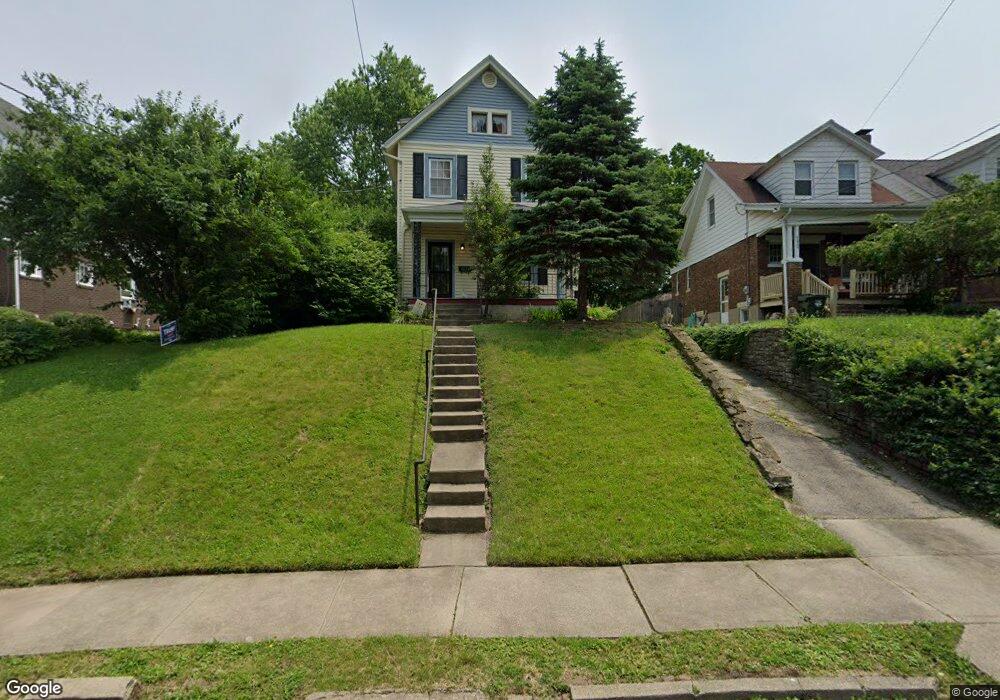
4024 Crosley Ave Cincinnati, OH 45212
Estimated Value: $223,000 - $273,000
3
Beds
2
Baths
1,454
Sq Ft
$169/Sq Ft
Est. Value
About This Home
This home is located at 4024 Crosley Ave, Cincinnati, OH 45212 and is currently estimated at $245,853, approximately $169 per square foot. 4024 Crosley Ave is a home located in Hamilton County with nearby schools including Norwood High School, Cornerstone Christian Academy, and Immaculate Conception Academy.
Ownership History
Date
Name
Owned For
Owner Type
Purchase Details
Closed on
Apr 7, 1998
Sold by
Meiser Charles L and Meiser Leslee A
Bought by
Lewandowski Gary C and Martin Margaret J
Current Estimated Value
Home Financials for this Owner
Home Financials are based on the most recent Mortgage that was taken out on this home.
Original Mortgage
$101,636
Interest Rate
7.19%
Mortgage Type
FHA
Create a Home Valuation Report for This Property
The Home Valuation Report is an in-depth analysis detailing your home's value as well as a comparison with similar homes in the area
Home Values in the Area
Average Home Value in this Area
Purchase History
We collect this data history from publicly available records. To have your information removed, we recommend requesting removal directly through your county’s website.
| Date | Buyer | Sale Price | Title Company |
|---|---|---|---|
| Lewandowski Gary C | $101,900 | -- |
Source: Public Records
Mortgage History
We collect this data history from publicly available records. To have your information removed, we recommend requesting removal directly through your county’s website.
| Date | Status | Borrower | Loan Amount |
|---|---|---|---|
| Closed | Lewandowski Gary C | $101,636 |
Source: Public Records
Tax History
| Year | Tax Paid | Tax Assessment Tax Assessment Total Assessment is a certain percentage of the fair market value that is determined by local assessors to be the total taxable value of land and additions on the property. | Land | Improvement |
|---|---|---|---|---|
| 2025 | $2,922 | $56,256 | $12,051 | $44,205 |
| 2023 | $2,917 | $56,256 | $12,051 | $44,205 |
| 2022 | $2,232 | $36,106 | $8,092 | $28,014 |
| 2021 | $2,169 | $36,106 | $8,092 | $28,014 |
| 2020 | $2,170 | $36,106 | $8,092 | $28,014 |
| 2019 | $2,063 | $31,672 | $7,098 | $24,574 |
| 2018 | $2,065 | $31,672 | $7,098 | $24,574 |
| 2017 | $1,954 | $31,672 | $7,098 | $24,574 |
| 2016 | $2,109 | $33,019 | $6,671 | $26,348 |
| 2015 | $1,875 | $33,019 | $6,671 | $26,348 |
| 2014 | $1,873 | $33,019 | $6,671 | $26,348 |
| 2013 | $1,971 | $35,130 | $7,098 | $28,032 |
Source: Public Records
Map
Nearby Homes
- 4064 Crosley Ave
- 1762 Williams Ave
- 4101 Carter Ave
- 4210 Lowry Ave
- 1828 Williams Ave
- 1813 Weyer Ave
- 1927 Hopkins Ave
- 4308 Carter Ave
- 4110 Wood St
- 1829 Lincoln Ave
- 1846 Lincoln Ave
- 3945 Regent Ave
- 4422 Franklin Ave
- 1731 Cleveland Ave
- 4206 Lafayette Ave
- 1817 Sherman Ave
- 2011 Hudson Ave
- 3936 Spencer Ave
- 4019 Elsmere Ave
- 3950 Elsmere Ave
- 4115 Huston Ave
- 4113 Huston Ave
- 4117 Huston Ave
- 4119 Huston Ave
- 4107 Huston Ave
- 4121 Huston Ave
- 4029 Huston Ave
- 4123 Huston Ave
- 4032 Crosley Ave
- 4034 Crosley Ave
- 4030 Crosley Ave
- 4027 Huston Ave
- 4038 Crosley Ave
- 4040 Crosley Ave
- 4028 Crosley Ave
- 4127 Huston Ave
- 4115 Bell St
- 4042 Crosley Ave
- 4025 Huston Ave
- 4044 Crosley Ave
Your Personal Tour Guide
Ask me questions while you tour the home.