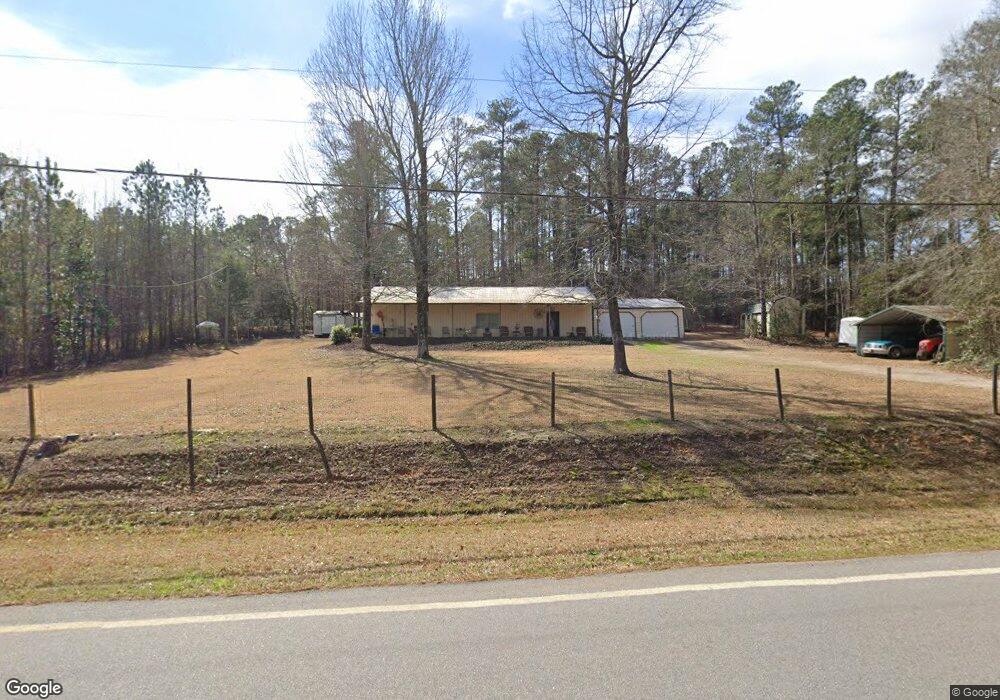
4028 Fish Hatchery Rd Dearing, GA 30808
Estimated Value: $217,497 - $318,000
1
Bed
1
Bath
1,800
Sq Ft
$148/Sq Ft
Est. Value
About This Home
This home is located at 4028 Fish Hatchery Rd, Dearing, GA 30808 and is currently estimated at $266,624, approximately $148 per square foot. 4028 Fish Hatchery Rd is a home with nearby schools including Thomson High School.
Ownership History
Date
Name
Owned For
Owner Type
Purchase Details
Closed on
Feb 15, 1984
Bought by
Belcher Ronald D
Current Estimated Value
Create a Home Valuation Report for This Property
The Home Valuation Report is an in-depth analysis detailing your home's value as well as a comparison with similar homes in the area
Purchase History
| Date | Buyer | Sale Price | Title Company |
|---|---|---|---|
| Belcher Ronald D | -- | -- |
Source: Public Records
Tax History
| Year | Tax Paid | Tax Assessment Tax Assessment Total Assessment is a certain percentage of the fair market value that is determined by local assessors to be the total taxable value of land and additions on the property. | Land | Improvement |
|---|---|---|---|---|
| 2025 | $995 | $65,169 | $1,289 | $63,880 |
| 2024 | $995 | $61,885 | $1,161 | $60,724 |
| 2023 | $1,040 | $12,910 | $1,161 | $11,749 |
| 2022 | $334 | $12,909 | $1,161 | $11,748 |
| 2021 | $345 | $12,875 | $1,127 | $11,748 |
| 2020 | $441 | $15,651 | $2,361 | $13,290 |
| 2019 | $446 | $15,651 | $2,361 | $13,290 |
| 2018 | $446 | $15,651 | $2,361 | $13,290 |
| 2017 | $430 | $15,651 | $2,361 | $13,290 |
| 2016 | $430 | $15,651 | $2,361 | $13,290 |
| 2015 | $427 | $17,047 | $3,757 | $13,290 |
| 2014 | $561 | $22,376 | $3,758 | $18,619 |
| 2013 | -- | $22,376 | $3,757 | $18,618 |
Source: Public Records
Map
Nearby Homes
- 4327 Iron Hill Rd
- 3619,3627, Bethany Ct
- 0 Mitchner Rd Unit 548843
- 3768 Mitchner Rd
- 3612 Deerfield Rd
- 3191 Old Augusta Rd
- 3116 Mitchner Road Extension
- 3175 Old Augusta Rd
- 3776 Wire Rd
- 2135 Rd
- 2111 Fort Creek Rd
- 5861 Luckeys Bridge Rd
- 4008 Wrens Hwy
- 4095 Wildwood Dr
- 841 Sweet Grass Cir
- 840 Sweet Grass Cir
- 856 Sweet Grass Cir
- 829 Sweet Grass Cir
- 828 Sweet Grass Cir
- 826 Sweet Grass Cir
- 4064 Fish Hatchery Rd
- 4026 Fish Hatchery Rd
- 3918 Ellington Airline Rd
- 4078 Fish Hatchery Rd
- 3992 Ellington Airline Rd
- 4547 Iron Hill Rd
- 4517 Iron Hill Rd
- 4441 Iron Hill Rd
- 4132 Fish Hatchery Rd
- 4103 Fish Hatchery Rd
- 4214 Luckys Bridge Rd
- 4214 Luckys Bridge Rd
- 4214 Luckeys Bridge Rd
- 4160 Fish Hatchery Rd
- 4221 Phillips Rabun Rd
- 4414 Iron Hill Rd
- 4414 Iron Hill Rd
- 4414 Iron Hill Rd
- 4226 Phillips Rabun Rd
- 4163 Fish Hatchery Rd
Your Personal Tour Guide
Ask me questions while you tour the home.