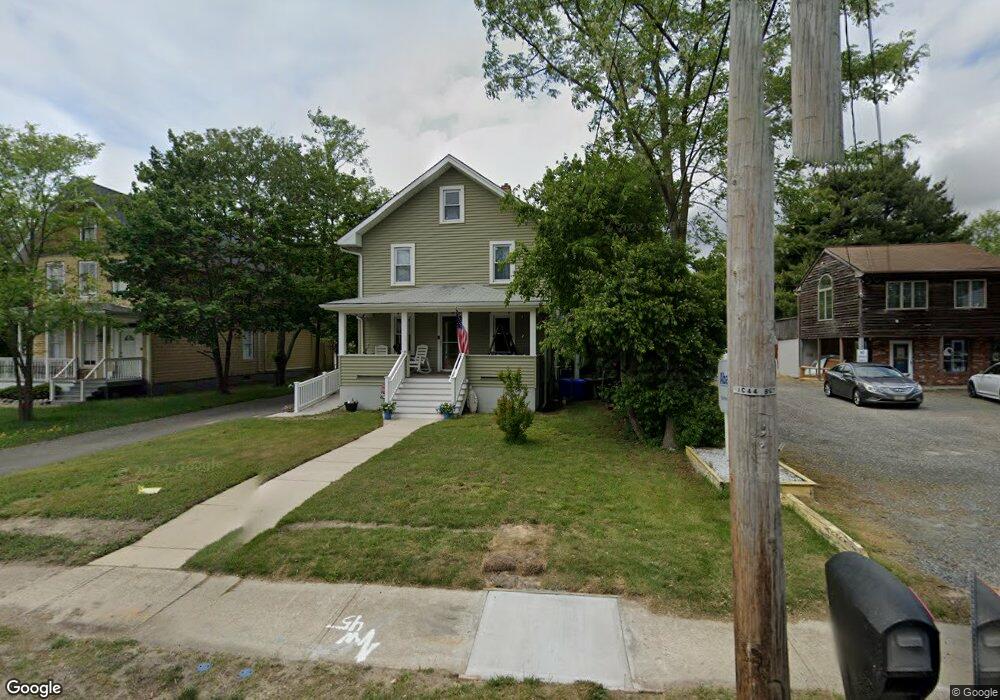
403 N Main St Barnegat, NJ 08005
Barnegat Township NeighborhoodEstimated Value: $408,000 - $519,000
3
Beds
4
Baths
1,872
Sq Ft
$248/Sq Ft
Est. Value
About This Home
This home is located at 403 N Main St, Barnegat, NJ 08005 and is currently estimated at $465,040, approximately $248 per square foot. 403 N Main St is a home located in Ocean County with nearby schools including Barnegat High School.
Ownership History
Date
Name
Owned For
Owner Type
Purchase Details
Closed on
Mar 15, 2011
Sold by
Dringus Philip E and Dringus Gloria Ann
Bought by
Dringus Christopher and Dringus Janna
Current Estimated Value
Home Financials for this Owner
Home Financials are based on the most recent Mortgage that was taken out on this home.
Original Mortgage
$150,000
Outstanding Balance
$56,498
Interest Rate
4.84%
Mortgage Type
Purchase Money Mortgage
Estimated Equity
$408,542
Purchase Details
Closed on
Jan 5, 2003
Sold by
A & M Development
Bought by
Italiano Onofrio
Create a Home Valuation Report for This Property
The Home Valuation Report is an in-depth analysis detailing your home's value as well as a comparison with similar homes in the area
Home Values in the Area
Average Home Value in this Area
Purchase History
| Date | Buyer | Sale Price | Title Company |
|---|---|---|---|
| Dringus Christopher | -- | None Available | |
| Italiano Onofrio | $107,500 | -- |
Source: Public Records
Mortgage History
| Date | Status | Borrower | Loan Amount |
|---|---|---|---|
| Open | Dringus Christopher | $150,000 |
Source: Public Records
Tax History
| Year | Tax Paid | Tax Assessment Tax Assessment Total Assessment is a certain percentage of the fair market value that is determined by local assessors to be the total taxable value of land and additions on the property. | Land | Improvement |
|---|---|---|---|---|
| 2025 | $7,692 | $249,500 | $112,500 | $137,000 |
| 2024 | $7,263 | $249,500 | $112,500 | $137,000 |
| 2023 | $7,028 | $249,500 | $112,500 | $137,000 |
| 2022 | $7,028 | $249,500 | $112,500 | $137,000 |
| 2021 | $6,944 | $249,500 | $112,500 | $137,000 |
| 2020 | $6,964 | $249,500 | $112,500 | $137,000 |
| 2019 | $6,861 | $249,500 | $112,500 | $137,000 |
| 2018 | $6,809 | $249,500 | $112,500 | $137,000 |
| 2017 | $6,697 | $249,500 | $112,500 | $137,000 |
| 2016 | $6,559 | $249,500 | $112,500 | $137,000 |
| 2015 | $6,352 | $249,500 | $112,500 | $137,000 |
| 2014 | $6,190 | $249,500 | $112,500 | $137,000 |
Source: Public Records
Map
Nearby Homes
- 6 Cedar St
- 367 N Main St
- 360 N Main St
- 330 Hawthorne Ln
- 280 Burr St Unit EXT
- 26 Ridgeway St
- 5 Jon Dr
- 268 Hawthorne Ln
- 266 Hawthorne Ln
- 239 Hawthorne Ln
- 69 Rosehill Rd
- 68 Memorial Dr
- 206 Hawthorne Ln
- 169 Emerson Ln
- 23 Twain Ave
- 11 Emerald Dr Unit A
- 48 S South Seas Ct
- 48 S Seas Ct Unit 11A
- 170 Gunning River Rd
- 9 Trinity Ct
Your Personal Tour Guide
Ask me questions while you tour the home.