Estimated Value: $143,000 - $174,004
About This Home
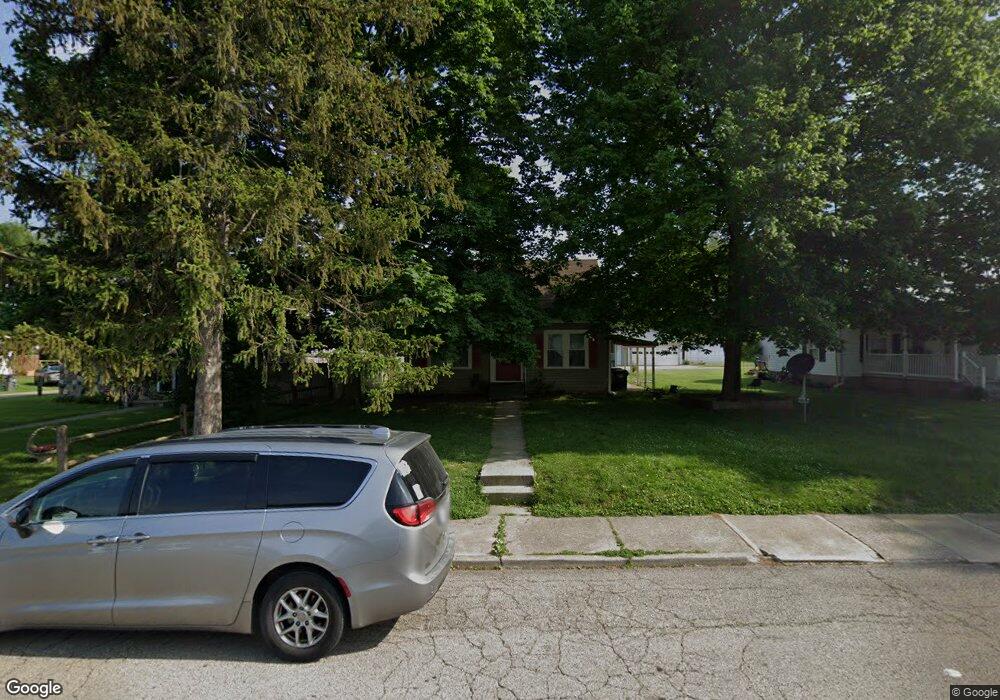
This home is located at 403 Troy St, Troy, OH 45373 and is currently estimated at $158,751, approximately $188 per square foot. 403 Troy St is a home located in Miami County with nearby schools including Cookson Elementary School, Troy Junior High School, and Van Cleve Elementary School.
Ownership History
We collect this data history from publicly available records. To have your information removed, we recommend requesting removal directly through your county’s website.
Purchase Details
Purchase Details
Home Financials for this Owner
Home Financials are based on the most recent Mortgage that was taken out on this home.Purchase Details
Purchase Details
Home Values in the Area
Average Home Value in this Area
Purchase History
We collect this data history from publicly available records. To have your information removed, we recommend requesting removal directly through your county’s website.
| Date | Buyer | Sale Price | Title Company |
|---|---|---|---|
| $50,000 | Attorney | ||
| $94,218 | -- | ||
| -- | -- | ||
| -- | -- |
Mortgage History
We collect this data history from publicly available records. To have your information removed, we recommend requesting removal directly through your county’s website.
| Date | Status | Borrower | Loan Amount |
|---|---|---|---|
| Previous Owner | $92,761 |
Tax History
We collect this data history from publicly available records. To have your information removed, we recommend requesting removal directly through your county’s website.
| Year | Tax Paid | Tax Assessment Tax Assessment Total Assessment is a certain percentage of the fair market value that is determined by local assessors to be the total taxable value of land and additions on the property. | Land | Improvement |
|---|---|---|---|---|
| 2025 | $1,774 | $49,110 | $8,580 | $40,530 |
| 2024 | $1,774 | $41,310 | $9,280 | $32,030 |
| 2023 | $1,591 | $41,310 | $9,280 | $32,030 |
| 2022 | $1,331 | $41,310 | $9,280 | $32,030 |
| 2021 | $1,078 | $31,780 | $7,140 | $24,640 |
| 2020 | $1,079 | $31,780 | $7,140 | $24,640 |
| 2019 | $1,089 | $31,780 | $7,140 | $24,640 |
| 2018 | $976 | $27,370 | $6,930 | $20,440 |
| 2017 | $986 | $27,370 | $6,930 | $20,440 |
| 2016 | $972 | $27,370 | $6,930 | $20,440 |
| 2015 | $913 | $25,350 | $6,410 | $18,940 |
| 2014 | $913 | $25,350 | $6,410 | $18,940 |
| 2013 | $919 | $25,350 | $6,410 | $18,940 |
Map
- 708 N Market St
- 814 N Market St
- 810 Meadow Ln
- 916 Mystic Ln
- 23 Dronfield Rd
- 617 Locust Ln
- 486 Locust Ln
- 1178 Stonyridge Ave
- 1142 Lee Rd
- 195 Finsbury Ln
- 1269 Stephenson Dr
- 1141 Lee Rd
- 1337 Maplecrest Dr
- 12 S Market St Unit 301
- 12 S Market St Unit 200
- 12 S Market St Unit 302
- 12 S Market St Unit 303
- 12 S Market St Unit 300
- 12 S Market St Unit 201
- 12 S Market St Unit 203
Ask me questions while you tour the home.