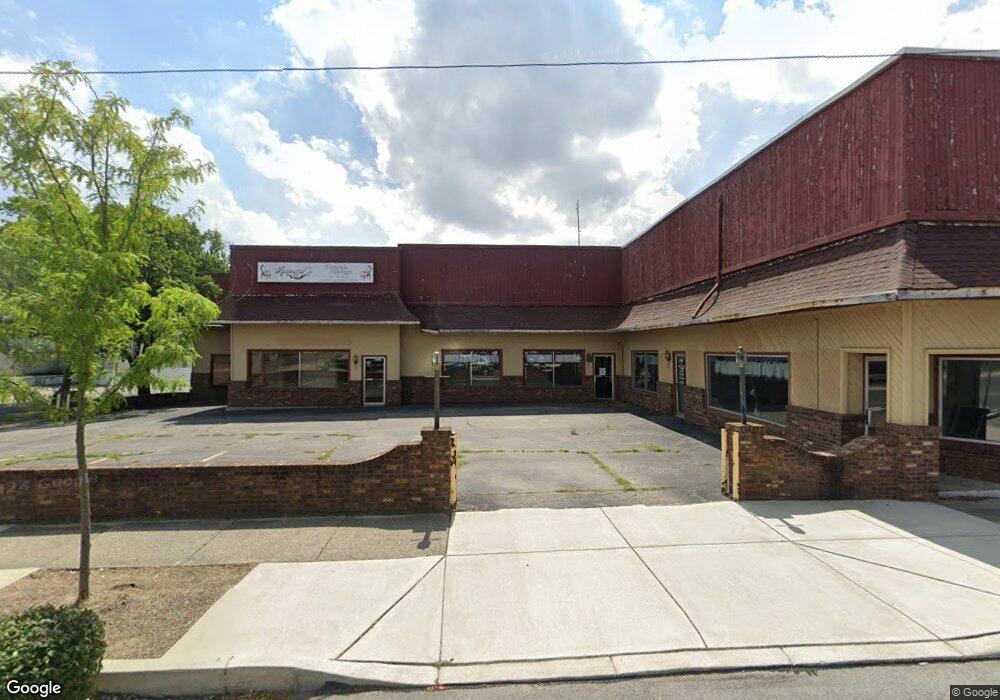
403 W High St Lima, OH 45801
Eastside Lima NeighborhoodEstimated Value: $136,888
Studio
--
Bath
11,872
Sq Ft
$12/Sq Ft
Est. Value
About This Home
This home is located at 403 W High St, Lima, OH 45801 and is currently estimated at $136,888, approximately $11 per square foot. 403 W High St is a home located in Allen County with nearby schools including Heritage Elementary School, Lima North Middle School, and Lima West Middle School.
Ownership History
Date
Name
Owned For
Owner Type
Purchase Details
Closed on
May 4, 2017
Sold by
Downtown Lima Properties Llc
Bought by
Big Dream 403 Llc
Current Estimated Value
Purchase Details
Closed on
Jan 10, 2005
Sold by
Tri C Enterprises Llc
Bought by
Downtown Lima Properties Llc
Home Financials for this Owner
Home Financials are based on the most recent Mortgage that was taken out on this home.
Original Mortgage
$200,000
Interest Rate
5.78%
Mortgage Type
Future Advance Clause Open End Mortgage
Purchase Details
Closed on
Feb 8, 1985
Bought by
Cary Chester C
Create a Home Valuation Report for This Property
The Home Valuation Report is an in-depth analysis detailing your home's value as well as a comparison with similar homes in the area
Home Values in the Area
Average Home Value in this Area
Purchase History
| Date | Buyer | Sale Price | Title Company |
|---|---|---|---|
| Big Dream 403 Llc | $75,000 | None Available | |
| Downtown Lima Properties Llc | $200,000 | None Available | |
| Cary Chester C | $70,000 | -- |
Source: Public Records
Mortgage History
| Date | Status | Borrower | Loan Amount |
|---|---|---|---|
| Previous Owner | Downtown Lima Properties Llc | $200,000 |
Source: Public Records
Tax History
| Year | Tax Paid | Tax Assessment Tax Assessment Total Assessment is a certain percentage of the fair market value that is determined by local assessors to be the total taxable value of land and additions on the property. | Land | Improvement |
|---|---|---|---|---|
| 2024 | $3,251 | $66,120 | $21,880 | $44,240 |
| 2023 | $3,271 | $60,100 | $19,880 | $40,220 |
| 2022 | $3,214 | $60,100 | $19,880 | $40,220 |
| 2021 | $3,372 | $60,100 | $19,880 | $40,220 |
| 2020 | $3,258 | $52,400 | $19,880 | $32,520 |
| 2019 | $3,258 | $52,400 | $19,880 | $32,520 |
| 2018 | $3,158 | $52,400 | $19,880 | $32,520 |
| 2017 | $3,143 | $52,400 | $19,880 | $32,520 |
| 2016 | $3,185 | $52,360 | $19,880 | $32,480 |
| 2015 | $3,137 | $52,360 | $19,880 | $32,480 |
| 2014 | $3,137 | $51,450 | $19,880 | $31,570 |
| 2013 | $3,038 | $51,450 | $19,880 | $31,570 |
Source: Public Records
Map
Nearby Homes
- 325 N McDonel St
- 631 Brice Ave
- 431 N Metcalf St
- 325 Nye St
- 417 S McDonel St
- 210 S Baxter St
- 745 Richie Ave
- 846 Faurot Ave
- 852 Faurot Ave
- 3 House Package
- 705 W Elm St
- 616-616.5 N Elizabeth St
- 555 Haller St
- 932 Faurot Ave
- 508 N Collett St
- 416 Hazel Ave
- 426 S Baxter St
- 419 S Atlantic Ave
- 129 S Pine St
- 145 S Pine St
- 127 N Pierce St
- 417 W High St
- 404 W Market St
- 11 Door Package
- 418 W Market St
- 330 W Market St
- 14 Rental Package
- 9 Unit Real Estate Package
- 125 N McDonel St
- 223 N McDonel St
- 121 N West St
- 13 SFR B N Package St
- 119 N West St
- 119 N West Unit 3 Lease
- 7 Unit Rental Package
- 16 Renovation Opportunities
- 300 Market W
- 311 W Market St
- 319 W North St Unit Moreland
Your Personal Tour Guide
Ask me questions while you tour the home.