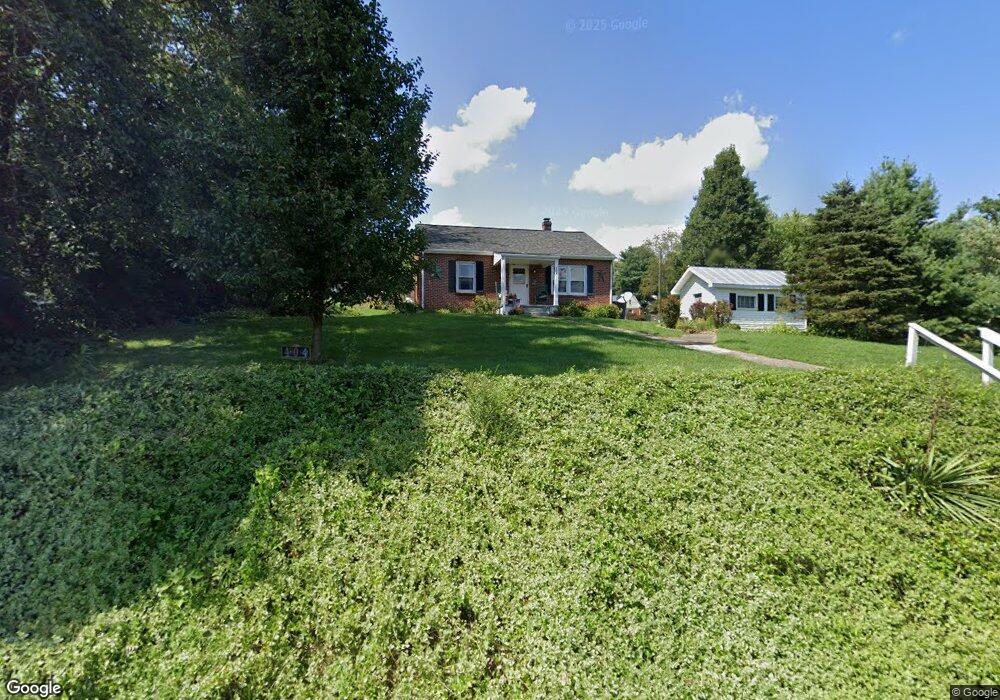
404 2nd St Buchanan, VA 24066
Estimated Value: $192,463 - $235,000
2
Beds
1
Bath
896
Sq Ft
$235/Sq Ft
Est. Value
About This Home
This home is located at 404 2nd St, Buchanan, VA 24066 and is currently estimated at $210,616, approximately $235 per square foot. 404 2nd St is a home located in Botetourt County with nearby schools including Buchanan Elementary School, Central Academy Middle School, and James River High School.
Ownership History
Date
Name
Owned For
Owner Type
Purchase Details
Closed on
Feb 23, 2016
Sold by
King Kenneth Riley and King Brittney C
Bought by
King Kenneth Riley and King Brittney C
Current Estimated Value
Home Financials for this Owner
Home Financials are based on the most recent Mortgage that was taken out on this home.
Original Mortgage
$79,500
Outstanding Balance
$62,899
Interest Rate
3.72%
Mortgage Type
New Conventional
Estimated Equity
$147,717
Create a Home Valuation Report for This Property
The Home Valuation Report is an in-depth analysis detailing your home's value as well as a comparison with similar homes in the area
Purchase History
| Date | Buyer | Sale Price | Title Company |
|---|---|---|---|
| King Kenneth Riley | -- | None Available |
Source: Public Records
Mortgage History
| Date | Status | Borrower | Loan Amount |
|---|---|---|---|
| Open | King Kenneth Riley | $79,500 |
Source: Public Records
Tax History
| Year | Tax Paid | Tax Assessment Tax Assessment Total Assessment is a certain percentage of the fair market value that is determined by local assessors to be the total taxable value of land and additions on the property. | Land | Improvement |
|---|---|---|---|---|
| 2025 | $985 | $140,700 | $26,900 | $113,800 |
| 2024 | $985 | $140,700 | $26,900 | $113,800 |
| 2023 | $785 | $99,400 | $22,400 | $77,000 |
| 2022 | $785 | $99,400 | $22,400 | $77,000 |
| 2021 | $785 | $99,400 | $22,400 | $77,000 |
| 2020 | $785 | $99,400 | $22,400 | $77,000 |
| 2019 | $766 | $96,900 | $22,400 | $74,500 |
| 2018 | $766 | $96,900 | $22,400 | $74,500 |
| 2017 | $766 | $96,900 | $22,400 | $74,500 |
| 2016 | $766 | $96,900 | $22,400 | $74,500 |
| 2015 | $649 | $90,200 | $22,400 | $67,800 |
| 2014 | $649 | $90,200 | $22,400 | $67,800 |
| 2010 | -- | $90,200 | $22,400 | $67,800 |
Source: Public Records
Map
Nearby Homes
- 275 1st St
- 262 Lowe St
- 36 Boyd St
- 0 Main St Unit 920034
- TBD Main St
- 00 Lee Hwy
- 33 James River Terrace
- 2545 Pico Rd
- 1905 Mount Joy Rd
- Lot 10 Park Vista Dr
- 222 Cove Mountain Ln
- 9195 Springwood Rd
- 0 Goose Creek Valley Rd Unit 925966
- 411 Hardbarger Rd
- 1333 Falling Leaf Ln
- 6102 Jennings Creek Rd
- 2836 Buffalo Rd
- 2201 Lithia Rd
- 540 Wagon Wheel Run
- 2883 Timber Ridge
Your Personal Tour Guide
Ask me questions while you tour the home.