405 Farrell St Norfolk, VA 23503
Northside NeighborhoodEstimated Value: $338,000 - $350,270
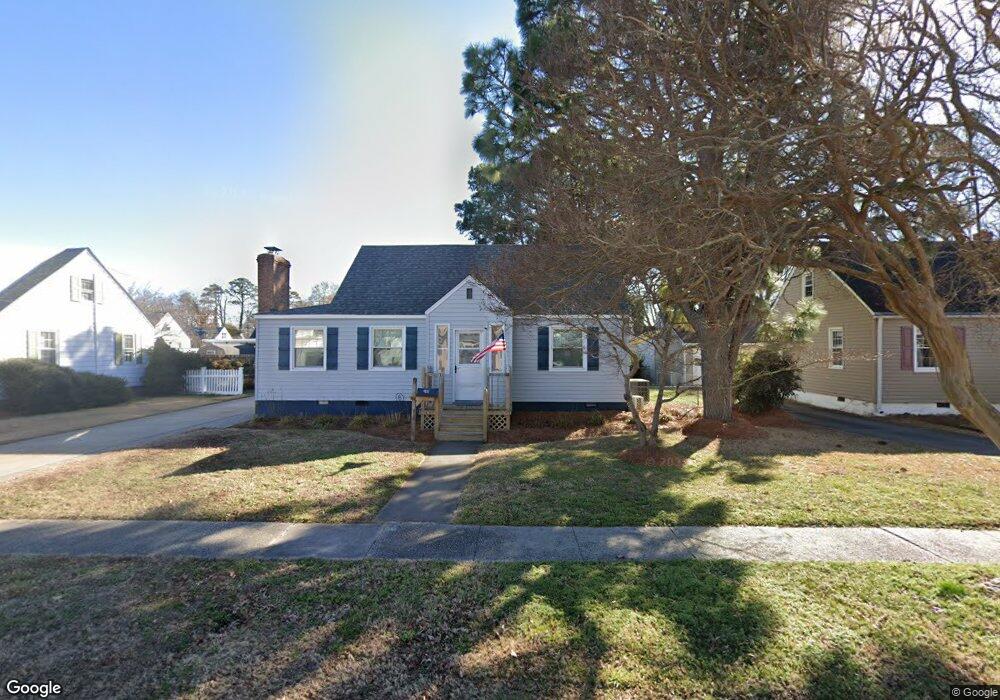
About This Home
This home is located at 405 Farrell St, Norfolk, VA 23503 and is currently estimated at $344,818, approximately $225 per square foot. 405 Farrell St is a home located in Norfolk City with nearby schools including Mary Calcott Elementary School, Northside Middle School, and Granby High School.
Ownership History
We collect this data history from publicly available records. To have your information removed, we recommend requesting removal directly through your county’s website.
Purchase Details
Home Financials for this Owner
Home Financials are based on the most recent Mortgage that was taken out on this home.Home Values in the Area
Average Home Value in this Area
Purchase History
We collect this data history from publicly available records. To have your information removed, we recommend requesting removal directly through your county’s website.
| Date | Buyer | Sale Price | Title Company |
|---|---|---|---|
| $330,000 | First American Title |
Mortgage History
We collect this data history from publicly available records. To have your information removed, we recommend requesting removal directly through your county’s website.
| Date | Status | Borrower | Loan Amount |
|---|---|---|---|
| Open | $337,095 |
Tax History
We collect this data history from publicly available records. To have your information removed, we recommend requesting removal directly through your county’s website.
| Year | Tax Paid | Tax Assessment Tax Assessment Total Assessment is a certain percentage of the fair market value that is determined by local assessors to be the total taxable value of land and additions on the property. | Land | Improvement |
|---|---|---|---|---|
| 2025 | $3,954 | $321,500 | $78,500 | $243,000 |
| 2024 | $2,385 | $190,800 | $78,500 | $112,300 |
| 2023 | $2,318 | $185,400 | $78,500 | $106,900 |
| 2022 | $2,199 | $175,900 | $69,900 | $106,000 |
| 2021 | $2,050 | $164,000 | $63,500 | $100,500 |
| 2020 | $1,901 | $152,100 | $55,000 | $97,100 |
| 2019 | $1,839 | $147,100 | $50,000 | $97,100 |
| 2018 | $1,736 | $138,900 | $50,000 | $88,900 |
| 2017 | $1,573 | $136,800 | $50,000 | $86,800 |
| 2016 | $1,573 | $139,700 | $50,000 | $89,700 |
| 2015 | $1,607 | $139,700 | $50,000 | $89,700 |
| 2014 | $1,607 | $139,700 | $50,000 | $89,700 |
Map
- 406 E Westmont Ave
- 417 E Westmont Ave
- 8710 Tidewater Dr
- 503 E Westmont Ave
- 227 Twilley St
- 245 Winshire St
- 8710 Meadow Brook Ln
- 214 E Chester St
- 511 Dune St
- 318 E Evans St
- 8641 Chapin St
- 230 New St
- 8629 Chapin St
- 403 Fresh Meadow Rd
- 8621 Chapin St
- 329 E Randall Ave
- 135 Howe St
- 336 E Randall Ave
- 224 Neoma Dr
- 500 E Bayview Blvd
- 405 Farrell St
- 405 Farrell St Unit C
- 405 Farrell St Unit B
- 405 Farrell St Unit A
- 403 Farrell St
- 407 Farrell St
- 406 Beck St
- 404 Beck St
- 408 Beck St
- 409 Farrell St
- 406 Farrell St
- 404 Farrell St
- 8812 Tidewater Dr
- 8810 Tidewater Dr
- 410 Beck St
- 408 Farrell St
- 402 Farrell St
- 8808 Tidewater Dr
- 411 Farrell St
- 410 Farrell St
Ask me questions while you tour the home.