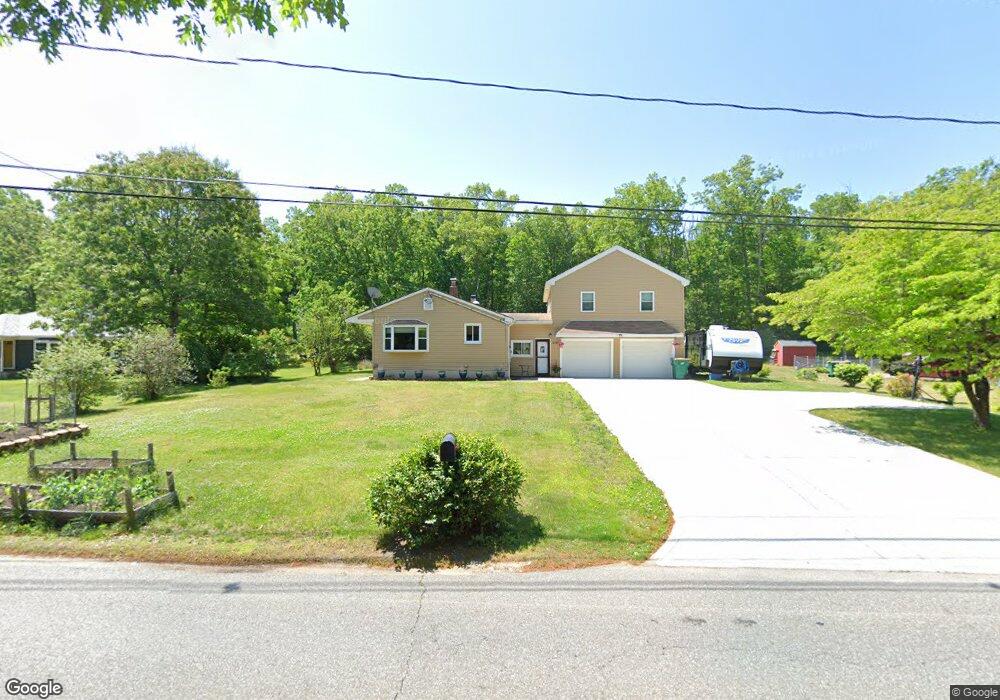
405 River Rd Uxbridge, MA 01569
Estimated Value: $471,000 - $612,000
About This Home
This home is located at 405 River Rd, Uxbridge, MA 01569 and is currently estimated at $560,223, approximately $262 per square foot. 405 River Rd is a home located in Worcester County with nearby schools including Uxbridge High School.
Ownership History
We collect this data history from publicly available records. To have your information removed, we recommend requesting removal directly through your county’s website.
Purchase Details
Home Financials for this Owner
Home Financials are based on the most recent Mortgage that was taken out on this home.Purchase Details
Purchase Details
Home Financials for this Owner
Home Financials are based on the most recent Mortgage that was taken out on this home.Home Values in the Area
Average Home Value in this Area
Purchase History
We collect this data history from publicly available records. To have your information removed, we recommend requesting removal directly through your county’s website.
| Date | Buyer | Sale Price | Title Company |
|---|---|---|---|
| -- | -- | ||
| -- | -- | ||
| -- | -- | ||
| $275,000 | -- | ||
| $275,000 | -- |
Mortgage History
We collect this data history from publicly available records. To have your information removed, we recommend requesting removal directly through your county’s website.
| Date | Status | Borrower | Loan Amount |
|---|---|---|---|
| Open | $228,000 | ||
| Previous Owner | $200,000 |
Tax History
We collect this data history from publicly available records. To have your information removed, we recommend requesting removal directly through your county’s website.
| Year | Tax Paid | Tax Assessment Tax Assessment Total Assessment is a certain percentage of the fair market value that is determined by local assessors to be the total taxable value of land and additions on the property. | Land | Improvement |
|---|---|---|---|---|
| 2025 | $55 | $421,200 | $134,700 | $286,500 |
| 2024 | $5,353 | $414,300 | $127,800 | $286,500 |
| 2023 | $4,820 | $345,500 | $110,500 | $235,000 |
| 2022 | $4,540 | $299,500 | $96,700 | $202,800 |
| 2021 | $4,619 | $292,000 | $96,700 | $195,300 |
| 2020 | $4,759 | $284,300 | $103,600 | $180,700 |
| 2019 | $5,113 | $294,700 | $114,000 | $180,700 |
| 2018 | $5,002 | $291,300 | $114,000 | $177,300 |
| 2017 | $4,652 | $274,300 | $107,100 | $167,200 |
| 2016 | $4,519 | $257,200 | $82,900 | $174,300 |
| 2015 | $4,428 | $254,500 | $82,900 | $171,600 |
Map
- 90 Chestnut Hill Rd
- 34 Lincoln St
- 107 B Providence St Unit A
- 57 Kempton Rd
- 179 Thayer St
- 111 Cider Mill Rd
- 342 Chestnut St
- 50 Main St
- 0 Buxton St Unit 1386233
- 42 Mechanic St
- 1003 Victory Hwy
- 325 Buxton St
- 1 Lorraine Ln
- 110 Fisher St
- 70 Hill St
- 85 East St
- 14R Orchard St
- 40 School St
- 70 Milk St
- 117 Quaker Hwy Unit 32
Ask me questions while you tour the home.