Estimated Value: $112,000 - $234,000
3
Beds
2
Baths
1,656
Sq Ft
$92/Sq Ft
Est. Value
About This Home
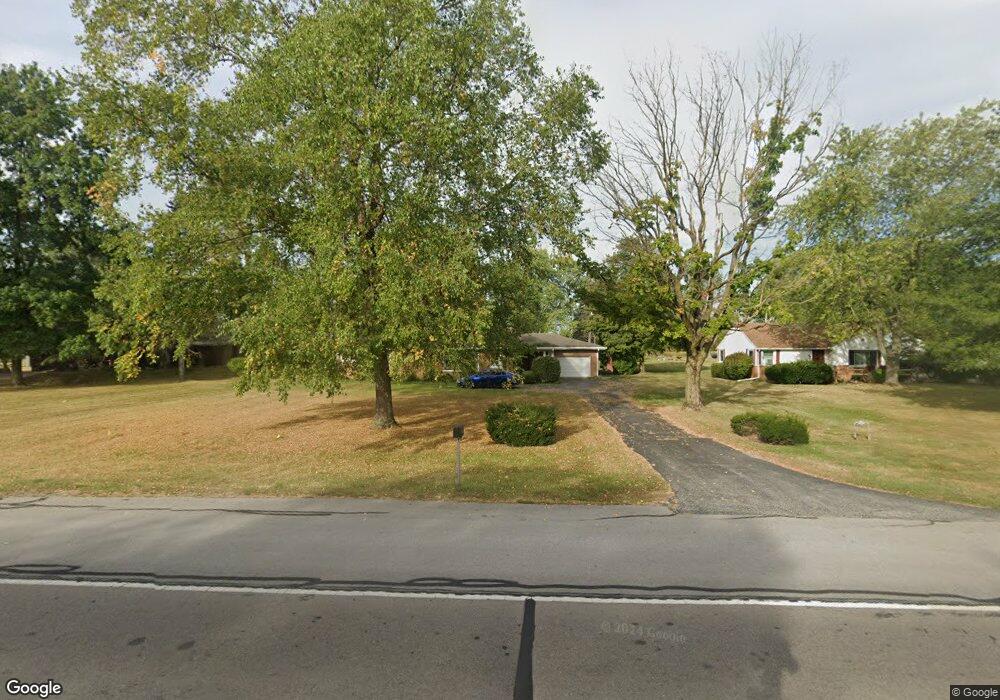
This home is located at 406 S Main St, Lynn, IN 47355 and is currently estimated at $151,850, approximately $91 per square foot. 406 S Main St is a home located in Randolph County with nearby schools including Randolph Southern Elementary School and Randolph Southern Junior/Senior High School.
Ownership History
Date
Name
Owned For
Owner Type
Purchase Details
Closed on
Aug 31, 2021
Sold by
Chenoweth James
Bought by
Naylor Kyler
Current Estimated Value
Home Financials for this Owner
Home Financials are based on the most recent Mortgage that was taken out on this home.
Original Mortgage
$73,150
Outstanding Balance
$65,723
Interest Rate
2.7%
Mortgage Type
New Conventional
Estimated Equity
$86,127
Purchase Details
Closed on
Jan 19, 2019
Sold by
Allen Barbara J Chenoweth
Bought by
Chenoweth James F
Purchase Details
Closed on
Jan 17, 2019
Sold by
Stevenson Catherine A
Bought by
Chenoweth James F
Purchase Details
Closed on
Jun 24, 2016
Sold by
G Frank Chenoweth Trust
Bought by
Joann M Chenoweth Trust
Create a Home Valuation Report for This Property
The Home Valuation Report is an in-depth analysis detailing your home's value as well as a comparison with similar homes in the area
Purchase History
| Date | Buyer | Sale Price | Title Company |
|---|---|---|---|
| Naylor Kyler | $77,000 | None Available | |
| Chenoweth James F | -- | None Available | |
| Chenoweth James F | -- | None Available | |
| Chenoweth James F | -- | None Available | |
| Joann M Chenoweth Trust | -- | None Available |
Source: Public Records
Mortgage History
| Date | Status | Borrower | Loan Amount |
|---|---|---|---|
| Open | Naylor Kyler | $73,150 |
Source: Public Records
Tax History
| Year | Tax Paid | Tax Assessment Tax Assessment Total Assessment is a certain percentage of the fair market value that is determined by local assessors to be the total taxable value of land and additions on the property. | Land | Improvement |
|---|---|---|---|---|
| 2025 | $861 | $113,100 | $17,000 | $96,100 |
| 2024 | $861 | $90,800 | $11,600 | $79,200 |
| 2023 | $815 | $90,800 | $11,600 | $79,200 |
| 2022 | $974 | $94,100 | $11,600 | $82,500 |
| 2021 | $1,109 | $107,600 | $15,300 | $92,300 |
| 2020 | $1,943 | $95,400 | $13,300 | $82,100 |
| 2019 | $1,891 | $92,800 | $13,300 | $79,500 |
| 2018 | $964 | $92,800 | $13,300 | $79,500 |
| 2017 | $917 | $92,100 | $13,300 | $78,800 |
| 2016 | $907 | $92,500 | $12,100 | $80,400 |
| 2014 | $742 | $85,400 | $11,500 | $73,900 |
| 2013 | $742 | $82,800 | $11,500 | $71,300 |
Source: Public Records
Map
Nearby Homes
- 316 N Main St
- 703 Westwood Dr
- 306 Price St
- 1319 Hopewell Rd
- 00 N Center Rd
- 5818 S Arba Pike
- 107 N US Highway 27
- 701 W Cherry St
- 301 S Front St
- 8663 N Centerville Rd
- 00 Fountain City Pike
- 10019 S 475 W
- 4668 S State Road 227
- 8191 U S 35
- TBD U S 35
- 6497 S 500 W
- 0 Greenville-Nashville Rd Unit 934533
- 1041 S Huntsville Rd
- 1027 S Huntsville Rd
- 19 Deer Cross Dr
Your Personal Tour Guide
Ask me questions while you tour the home.