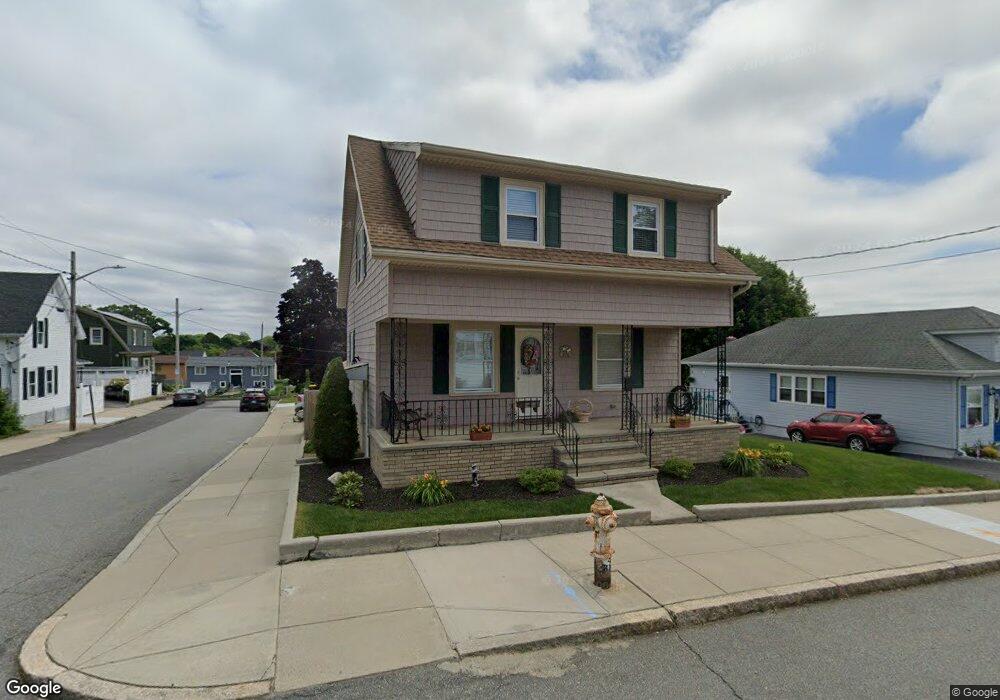
407 Eddy St Fall River, MA 02723
Bank Street NeighborhoodEstimated Value: $384,000 - $448,000
3
Beds
2
Baths
1,603
Sq Ft
$256/Sq Ft
Est. Value
About This Home
This home is located at 407 Eddy St, Fall River, MA 02723 and is currently estimated at $410,557, approximately $256 per square foot. 407 Eddy St is a home located in Bristol County with nearby schools including Mary Fonseca Elementary School, Talbot Innovation School, and B M C Durfee High School.
Ownership History
Date
Name
Owned For
Owner Type
Purchase Details
Closed on
May 4, 2011
Sold by
Afonso Albert and Afonso Eileen
Bought by
A & E Afonso Irt
Current Estimated Value
Purchase Details
Closed on
Jun 24, 1981
Bought by
A & E Afonso Irt
Create a Home Valuation Report for This Property
The Home Valuation Report is an in-depth analysis detailing your home's value as well as a comparison with similar homes in the area
Home Values in the Area
Average Home Value in this Area
Purchase History
| Date | Buyer | Sale Price | Title Company |
|---|---|---|---|
| A & E Afonso Irt | -- | -- | |
| A & E Afonso Irt | $33,000 | -- |
Source: Public Records
Mortgage History
| Date | Status | Borrower | Loan Amount |
|---|---|---|---|
| Previous Owner | A & E Afonso Irt | $50,000 | |
| Previous Owner | A & E Afonso Irt | $33,000 |
Source: Public Records
Tax History
| Year | Tax Paid | Tax Assessment Tax Assessment Total Assessment is a certain percentage of the fair market value that is determined by local assessors to be the total taxable value of land and additions on the property. | Land | Improvement |
|---|---|---|---|---|
| 2025 | $3,657 | $319,400 | $124,000 | $195,400 |
| 2024 | $3,467 | $301,700 | $119,300 | $182,400 |
| 2023 | $3,418 | $278,600 | $102,300 | $176,300 |
| 2022 | $3,039 | $240,800 | $93,000 | $147,800 |
| 2021 | $2,874 | $207,800 | $86,000 | $121,800 |
| 2020 | $2,702 | $187,000 | $82,300 | $104,700 |
| 2019 | $2,620 | $179,700 | $78,400 | $101,300 |
| 2018 | $2,570 | $175,800 | $77,000 | $98,800 |
| 2017 | $2,458 | $175,600 | $78,500 | $97,100 |
| 2016 | $2,372 | $174,000 | $81,800 | $92,200 |
| 2015 | $2,237 | $171,000 | $78,800 | $92,200 |
| 2014 | $2,203 | $175,100 | $82,900 | $92,200 |
Source: Public Records
Map
Nearby Homes
- 243 Oak Grove Ave
- 585 N Eastern Ave
- 217 Plain St
- 168 Windsor St
- 295 Newbury St
- 742 New Boston Rd
- 10 Carlisa Dr
- 84 Healy St
- 18 Carlisa Dr
- 869 Bedford St
- 108 Garden St
- 58 Bowler St
- 545 Robeson St
- 243 Robeson St Unit 6
- 243 Robeson St Unit 3
- 150 Downing St
- 119-121 Tremont St
- 139 Quarry St
- 90 Tremont St
- 194 Albion St
Your Personal Tour Guide
Ask me questions while you tour the home.