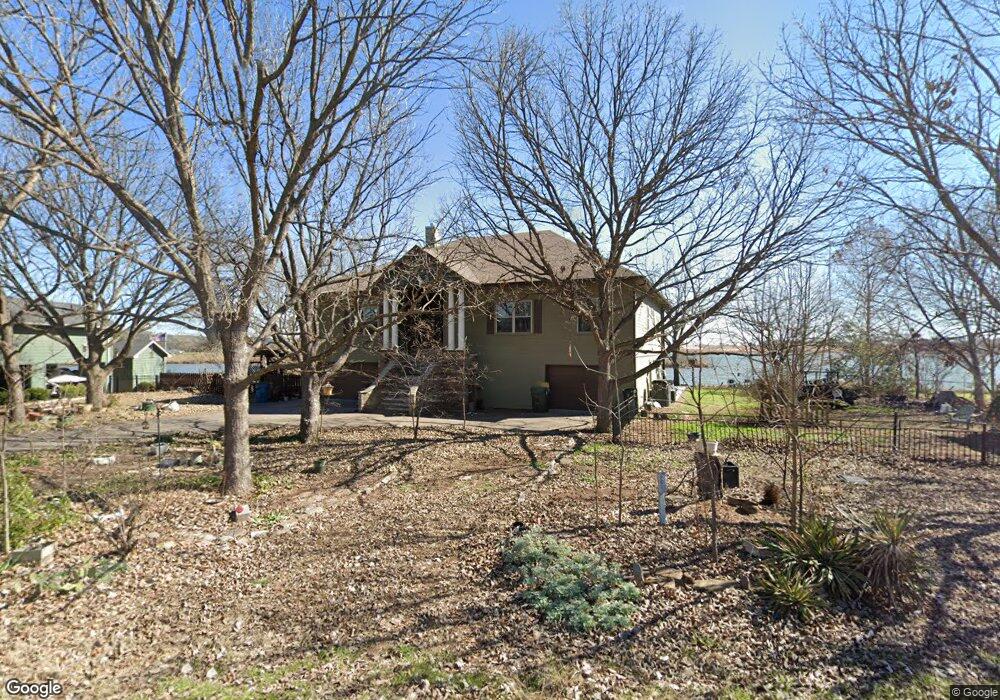
407 Mars Ct Granbury, TX 76049
Estimated Value: $515,000 - $929,000
Studio
--
Bath
2,380
Sq Ft
$337/Sq Ft
Est. Value
About This Home
This home is located at 407 Mars Ct, Granbury, TX 76049 and is currently estimated at $802,257, approximately $337 per square foot. 407 Mars Ct is a home with nearby schools including Brawner Elementary School, Granbury Middle School, and Granbury High School.
Ownership History
Date
Name
Owned For
Owner Type
Purchase Details
Closed on
Jun 11, 2001
Sold by
Braziel Clayton A and Braziel Keith
Bought by
Tingley James W
Current Estimated Value
Purchase Details
Closed on
Aug 27, 1997
Sold by
Curlee Homer L and Curlee Ruth C
Bought by
Tingley James W
Purchase Details
Closed on
Sep 15, 1974
Bought by
Tingley James W
Create a Home Valuation Report for This Property
The Home Valuation Report is an in-depth analysis detailing your home's value as well as a comparison with similar homes in the area
Home Values in the Area
Average Home Value in this Area
Purchase History
We collect this data history from publicly available records. To have your information removed, we recommend requesting removal directly through your county’s website.
| Date | Buyer | Sale Price | Title Company |
|---|---|---|---|
| Tingley James W | -- | -- | |
| Tingley James W | -- | -- | |
| Tingley James W | -- | -- |
Source: Public Records
Tax History
| Year | Tax Paid | Tax Assessment Tax Assessment Total Assessment is a certain percentage of the fair market value that is determined by local assessors to be the total taxable value of land and additions on the property. | Land | Improvement |
|---|---|---|---|---|
| 2025 | $3,006 | $778,369 | $280,000 | $714,710 |
| 2024 | $3,018 | $707,608 | $280,000 | $682,580 |
| 2023 | $7,828 | $1,027,950 | $280,000 | $747,950 |
| 2022 | $5,524 | $972,670 | $215,000 | $757,670 |
| 2021 | $8,162 | $686,340 | $125,000 | $561,340 |
| 2020 | $7,506 | $483,310 | $125,000 | $358,310 |
| 2019 | $7,857 | $483,310 | $125,000 | $358,310 |
| 2018 | $7,312 | $449,740 | $125,000 | $324,740 |
| 2017 | $7,140 | $427,000 | $125,000 | $302,000 |
| 2016 | $6,661 | $417,620 | $130,000 | $287,620 |
| 2015 | $5,570 | $362,110 | $110,500 | $251,610 |
| 2014 | $5,570 | $362,110 | $110,500 | $251,610 |
Source: Public Records
Map
Nearby Homes
- 608 Casas Del Norte Ct
- 417 Sky Harbour Ct
- 419 Sky Harbour Ct
- 416 Granada Calle Ct
- 2700 Solar Ct
- 2801 Weylene Paseo
- 2808 Sky Harbour Dr
- 614 Pluto St
- 2810 Sky Harbour Dr
- 418 S Capricorn
- 433 Capricorn Dr
- 325 Capricorn Dr
- 327 Capricorn Dr
- 416 Capricorn Dr
- 707 Sun Ct
- 217 Casas Del Sur St
- 505 S Sky Ct
- 212 Casas Del Sur St
- 2804 Alta Vista Ct
- 3011 N Sky Ct
Your Personal Tour Guide
Ask me questions while you tour the home.