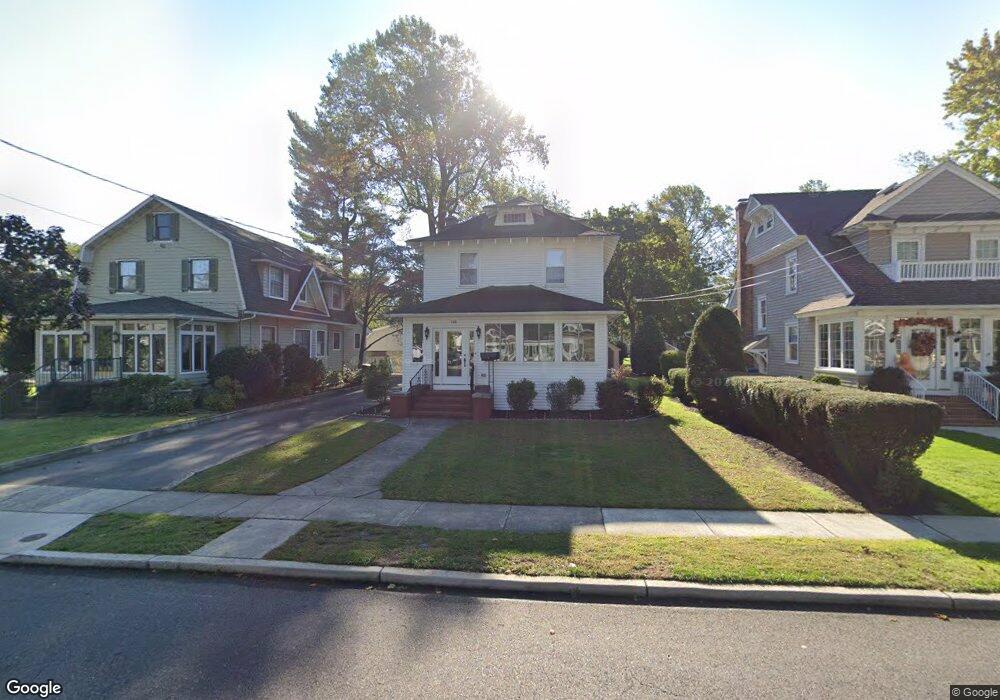
408 Grape St Hammonton, NJ 08037
Estimated Value: $262,133 - $364,000
Studio
--
Bath
1,521
Sq Ft
$219/Sq Ft
Est. Value
About This Home
This home is located at 408 Grape St, Hammonton, NJ 08037 and is currently estimated at $333,033, approximately $218 per square foot. 408 Grape St is a home located in Atlantic County with nearby schools including Hammonton Early Childhood Education Center, Warren E. Sooy Jr. Elementary School, and Hammonton Middle School.
Ownership History
Date
Name
Owned For
Owner Type
Purchase Details
Closed on
Jun 7, 2022
Sold by
Ciliberti John C and Ciliberti Helena D
Bought by
Ciliberti John C and Ciliberti Helene D
Current Estimated Value
Home Financials for this Owner
Home Financials are based on the most recent Mortgage that was taken out on this home.
Original Mortgage
$160,000
Outstanding Balance
$124,752
Interest Rate
2.9%
Mortgage Type
New Conventional
Estimated Equity
$208,281
Purchase Details
Closed on
Aug 30, 1999
Sold by
Ciliberti Alphonso J
Bought by
Ciliberti John C and Ciliberti Helena D
Create a Home Valuation Report for This Property
The Home Valuation Report is an in-depth analysis detailing your home's value as well as a comparison with similar homes in the area
Home Values in the Area
Average Home Value in this Area
Purchase History
We collect this data history from publicly available records. To have your information removed, we recommend requesting removal directly through your county’s website.
| Date | Buyer | Sale Price | Title Company |
|---|---|---|---|
| Ciliberti John C | -- | Vylla Title | |
| Ciliberti John C | -- | -- |
Source: Public Records
Mortgage History
We collect this data history from publicly available records. To have your information removed, we recommend requesting removal directly through your county’s website.
| Date | Status | Borrower | Loan Amount |
|---|---|---|---|
| Open | Ciliberti John C | $160,000 |
Source: Public Records
Tax History
| Year | Tax Paid | Tax Assessment Tax Assessment Total Assessment is a certain percentage of the fair market value that is determined by local assessors to be the total taxable value of land and additions on the property. | Land | Improvement |
|---|---|---|---|---|
| 2025 | $4,530 | $164,600 | $46,600 | $118,000 |
| 2024 | $4,530 | $164,600 | $46,600 | $118,000 |
| 2023 | $4,482 | $164,600 | $46,600 | $118,000 |
| 2022 | $4,482 | $164,600 | $46,600 | $118,000 |
| 2021 | $4,499 | $164,600 | $46,600 | $118,000 |
| 2020 | $4,475 | $164,600 | $46,600 | $118,000 |
| 2019 | $4,459 | $164,600 | $46,600 | $118,000 |
| 2018 | $4,438 | $164,600 | $46,600 | $118,000 |
| 2017 | $4,168 | $156,800 | $46,600 | $110,200 |
| 2016 | $4,016 | $156,800 | $46,600 | $110,200 |
| 2015 | $3,898 | $156,800 | $46,600 | $110,200 |
| 2014 | $3,427 | $92,400 | $24,300 | $68,100 |
Source: Public Records
Map
Nearby Homes
- 200 Walmer St
- 453 Bellevue Ave
- 26 N Packard St
- 551 Greenwood Dr
- 34 N Packard St
- 550 Bellevue Ave
- 40 Front St
- 228 Pleasant St E
- 113 N Packard St
- 131 N 2nd St
- 51 Harbor Dr
- 126 S Washington St
- 408 N Packard St
- 309 N 4th St
- 144 Broadway Unit B
- 144 Broadway Unit A
- 112 Washington St N
- 116 Washington St N
- 118 Washington St N
- 120 Washington St N
Your Personal Tour Guide
Ask me questions while you tour the home.