4085 Simca Ln Cincinnati, OH 45211
South Monfort Heights NeighborhoodEstimated Value: $256,136 - $339,000
About This Home
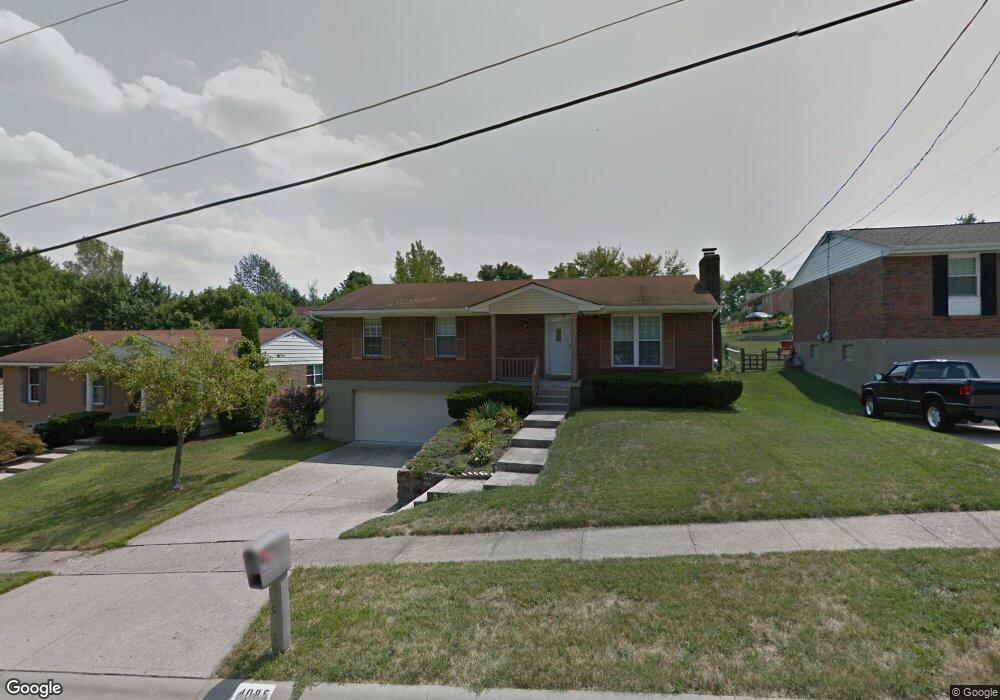
This home is located at 4085 Simca Ln, Cincinnati, OH 45211 and is currently estimated at $287,784, approximately $222 per square foot. 4085 Simca Ln is a home located in Hamilton County with nearby schools including Oakdale Elementary School, Bridgetown Middle School, and Oak Hills High School.
Ownership History
We collect this data history from publicly available records. To have your information removed, we recommend requesting removal directly through your county’s website.
Purchase Details
Home Financials for this Owner
Home Financials are based on the most recent Mortgage that was taken out on this home.Purchase Details
Home Values in the Area
Average Home Value in this Area
Purchase History
We collect this data history from publicly available records. To have your information removed, we recommend requesting removal directly through your county’s website.
| Date | Buyer | Sale Price | Title Company |
|---|---|---|---|
| $129,000 | Attorney | ||
| -- | Attorney |
Mortgage History
We collect this data history from publicly available records. To have your information removed, we recommend requesting removal directly through your county’s website.
| Date | Status | Borrower | Loan Amount |
|---|---|---|---|
| Open | $122,550 |
Tax History
We collect this data history from publicly available records. To have your information removed, we recommend requesting removal directly through your county’s website.
| Year | Tax Paid | Tax Assessment Tax Assessment Total Assessment is a certain percentage of the fair market value that is determined by local assessors to be the total taxable value of land and additions on the property. | Land | Improvement |
|---|---|---|---|---|
| 2025 | $3,366 | $64,534 | $11,827 | $52,707 |
| 2023 | $3,286 | $64,534 | $11,827 | $52,707 |
| 2022 | $3,000 | $49,935 | $11,512 | $38,423 |
| 2021 | $2,694 | $49,935 | $11,512 | $38,423 |
| 2020 | $2,729 | $49,935 | $11,512 | $38,423 |
| 2019 | $2,671 | $44,587 | $10,280 | $34,307 |
| 2018 | $2,675 | $44,587 | $10,280 | $34,307 |
| 2017 | $2,522 | $44,587 | $10,280 | $34,307 |
| 2016 | $2,557 | $45,151 | $10,182 | $34,969 |
| 2015 | $2,579 | $45,151 | $10,182 | $34,969 |
| 2014 | $2,582 | $45,151 | $10,182 | $34,969 |
| 2013 | $1,810 | $42,704 | $10,283 | $32,421 |
Map
- 4101 Turf Ln
- 4013 Westwood Northern Blvd
- 4027 Smith Rd
- 4023 Lovell Ave
- 3977 Kenkel Ave
- 4104 Trevor Ave
- 3935 Carrie Ave
- 3670 Gailynn Dr
- 4344 Homelawn Ave
- 3600 Westwood Northern Blvd
- 3949 Lovell Ave
- 3992 Glenmore Ave
- 3935 Washington Ave
- 3935 Lovell Ave
- 3616 Westwood Northern Blvd
- 4302 Marcrest Dr
- 3606 Homelawn Ave
- 4163 Harrison Ave
- 4163 Harrison Ave
- 4418 Harrison Ave
Ask me questions while you tour the home.