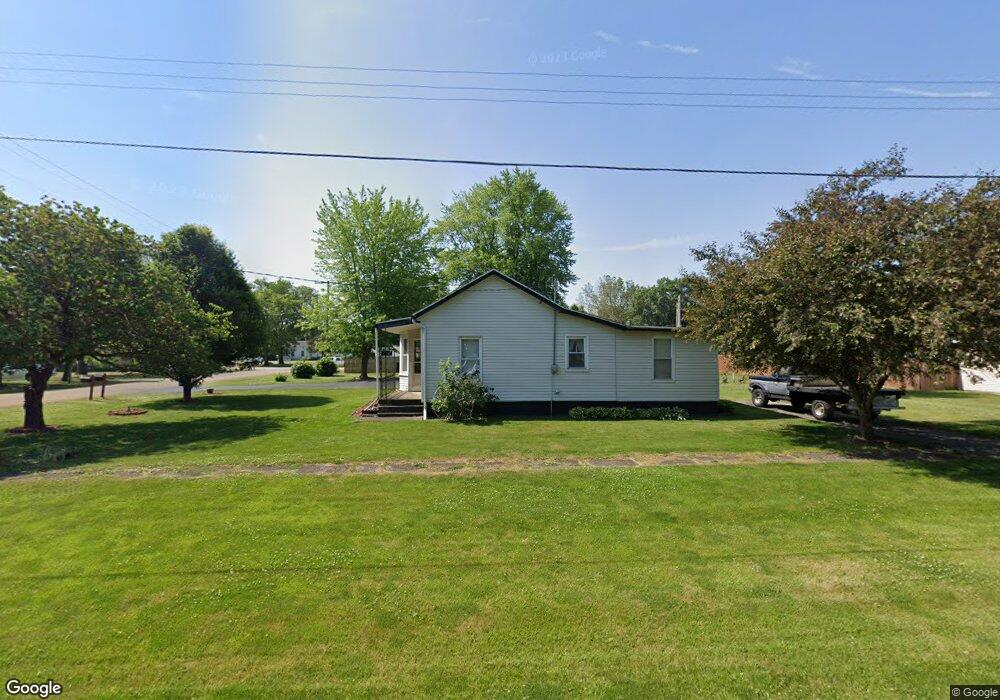
409 E 2nd St Atkinson, IL 61235
Estimated Value: $114,000 - $127,000
2
Beds
1
Bath
1,288
Sq Ft
$92/Sq Ft
Est. Value
About This Home
This home is located at 409 E 2nd St, Atkinson, IL 61235 and is currently estimated at $118,603, approximately $92 per square foot. 409 E 2nd St is a home located in Henry County with nearby schools including Geneseo High School.
Ownership History
Date
Name
Owned For
Owner Type
Purchase Details
Closed on
Feb 2, 2026
Sold by
Morgan Janette L and Capps Larry E
Bought by
Southwick Robert C and Southwick Laurie C
Current Estimated Value
Home Financials for this Owner
Home Financials are based on the most recent Mortgage that was taken out on this home.
Original Mortgage
$117,300
Outstanding Balance
$117,300
Interest Rate
6.18%
Mortgage Type
Credit Line Revolving
Estimated Equity
$1,303
Purchase Details
Closed on
Jun 7, 2021
Sold by
Capps Jackie R and Capps Charlotte
Bought by
Capps Larry E
Create a Home Valuation Report for This Property
The Home Valuation Report is an in-depth analysis detailing your home's value as well as a comparison with similar homes in the area
Purchase History
| Date | Buyer | Sale Price | Title Company |
|---|---|---|---|
| Southwick Robert C | $115,000 | None Listed On Document | |
| Capps Larry E | -- | Attorney |
Source: Public Records
Mortgage History
| Date | Status | Borrower | Loan Amount |
|---|---|---|---|
| Open | Southwick Robert C | $117,300 |
Source: Public Records
Tax History
| Year | Tax Paid | Tax Assessment Tax Assessment Total Assessment is a certain percentage of the fair market value that is determined by local assessors to be the total taxable value of land and additions on the property. | Land | Improvement |
|---|---|---|---|---|
| 2024 | $762 | $30,153 | $6,722 | $23,431 |
| 2023 | $747 | $27,816 | $6,201 | $21,615 |
| 2022 | $765 | $25,613 | $5,710 | $19,903 |
| 2021 | $786 | $23,716 | $5,287 | $18,429 |
| 2020 | $780 | $23,079 | $5,145 | $17,934 |
| 2019 | $780 | $23,598 | $5,068 | $18,530 |
| 2018 | $790 | $22,910 | $4,920 | $17,990 |
| 2017 | $792 | $22,308 | $4,791 | $17,517 |
| 2016 | $795 | $22,197 | $4,767 | $17,430 |
| 2015 | $356 | $21,598 | $4,767 | $16,831 |
| 2013 | $356 | $21,816 | $4,815 | $17,001 |
Source: Public Records
Map
Nearby Homes
- 420 Margaret St
- 203 Hamilton St
- 22308 N 2120th Ave
- 502 W Front St
- 108 S Main St
- 317 N Canal St
- 000 Hennepin Canal Parkway Trail
- 8 Pine Ridge Ln
- 918 S Chicago St
- 524 E Chestnut St
- 944 S Iowa St Unit 2
- 500 E Pearl St
- 623 E Park St
- 310 Hillcrest Dr
- 00 N Chicago St
- 817 S Illinois St
- 549 E Park St
- 0 S Oakwood Ave Unit MRDQC4257560
- 224 Pin Oak Dr
- 721 Ash Dr
- 403 E 2nd St
- 206 N Lincoln St
- 408 E Williams St
- 404 E Williams St
- 202 N Spring
- 408 E 2nd St
- 406 E 2nd St
- 202 N Lincoln St
- 503 E 2nd St
- 300 N Spring
- 200 N Lincoln St
- 502 E 2nd St
- 311 E 2nd St
- 504 E 2nd St
- 302 N Spring
- 407 E Williams St
- 409 E Williams St
- 405 E Williams St
- 309 E 2nd St
- 306 E Williams St
Your Personal Tour Guide
Ask me questions while you tour the home.