Estimated Value: $62,518 - $202,000
2
Beds
1
Bath
1,024
Sq Ft
$126/Sq Ft
Est. Value
About This Home
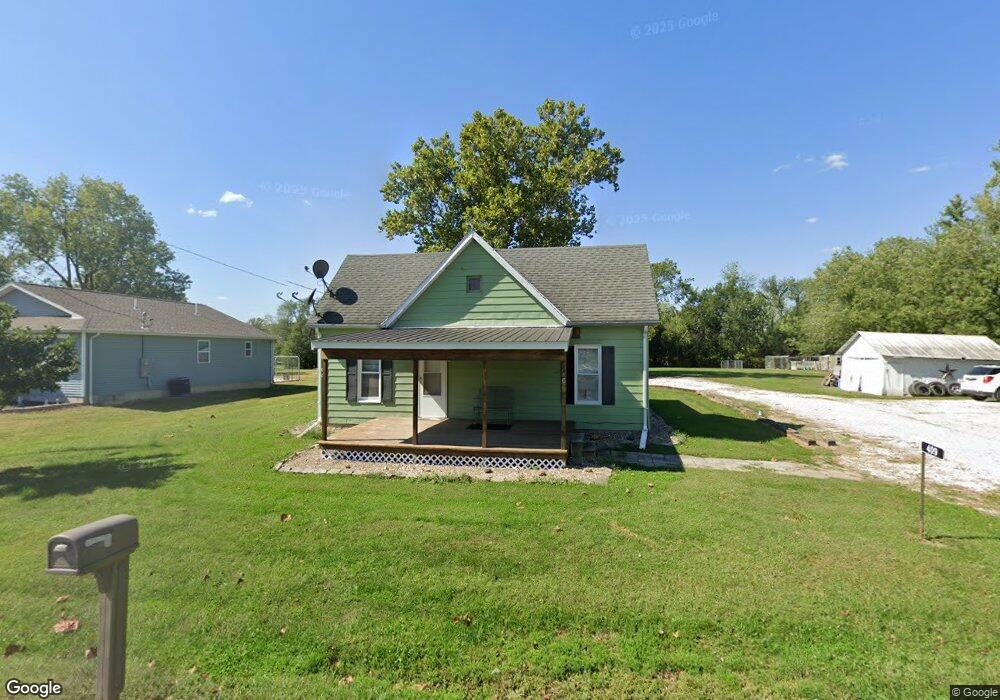
This home is located at 409 N Cherry St, Ewing, MO 63440 and is currently estimated at $129,130, approximately $126 per square foot. 409 N Cherry St is a home with nearby schools including Highland Elementary School and Highland Junior/Senior High School.
Ownership History
Date
Name
Owned For
Owner Type
Purchase Details
Closed on
Feb 21, 2020
Sold by
Rare Properties Llc
Bought by
Bauerrichter Keith R
Current Estimated Value
Home Financials for this Owner
Home Financials are based on the most recent Mortgage that was taken out on this home.
Original Mortgage
$48,000
Outstanding Balance
$32,330
Interest Rate
3.6%
Mortgage Type
New Conventional
Estimated Equity
$96,800
Create a Home Valuation Report for This Property
The Home Valuation Report is an in-depth analysis detailing your home's value as well as a comparison with similar homes in the area
Purchase History
| Date | Buyer | Sale Price | Title Company |
|---|---|---|---|
| Bauerrichter Keith R | -- | None Available |
Source: Public Records
Mortgage History
| Date | Status | Borrower | Loan Amount |
|---|---|---|---|
| Open | Bauerrichter Keith R | $48,000 |
Source: Public Records
Tax History
| Year | Tax Paid | Tax Assessment Tax Assessment Total Assessment is a certain percentage of the fair market value that is determined by local assessors to be the total taxable value of land and additions on the property. | Land | Improvement |
|---|---|---|---|---|
| 2025 | $280 | $4,510 | $370 | $4,140 |
| 2024 | $246 | $3,970 | $320 | $3,650 |
| 2023 | $242 | $3,970 | $320 | $3,650 |
| 2022 | $242 | $3,970 | $0 | $0 |
| 2021 | $241 | $3,970 | $0 | $0 |
| 2020 | $245 | $4,010 | $0 | $0 |
| 2019 | $215 | $4,010 | $0 | $0 |
| 2018 | $213 | $4,010 | $650 | $3,360 |
| 2017 | $190 | $4,010 | $650 | $3,360 |
| 2016 | $190 | $3,670 | $650 | $3,020 |
| 2015 | -- | $3,670 | $650 | $3,020 |
| 2013 | -- | $3,670 | $0 | $0 |
Source: Public Records
Map
Nearby Homes
- 24129 Granite Ave
- 20754 State Highway 6
- 9 Cr 261
- 20 Cr 261
- 3181 Highway P
- 22 Cr 228
- Lot 19 Black Oak Rd
- Lot 20 Black Oak Rd
- Lot 16 Black Oak Rd
- Lot 17 Black Oak Rd
- 13 Red Oak Rd
- Lot 23 Red Oak Rd
- Lot 1 Red Oak Rd
- Lot 22 Red Oak Rd
- Lot 21 Red Oak Rd
- Lot 24 Red Oak Rd
- Lot 1 Red Oak Rd
- 405 E Main St
- 105 S Cherry St
- 5414 County Road 150
- 407 N Cherry St
- 413 Cherry St
- 415 N Cherry St
- 0 Lakeview Dr Unit 16045567
- 0 Lakeview Dr Unit MRD12250851
- 0 Lakeview Dr Unit MRD12251553
- 5 Lakeview Dr
- 400 N Mckinley St
- 407 1/2 N Cherry St
- 320 N Mckinley St
- 405 N Cherry St
- 503 N Cherry St
- 403 Cherry St
- 301 E Clow St
- 0 Ironwood Unit 191316
- 0 Ironwood Unit MRD12252886
- 305 E Clow St
- 20 Lakeview Dr
- 209 E Clow St
- 404 E Clow St
Your Personal Tour Guide
Ask me questions while you tour the home.