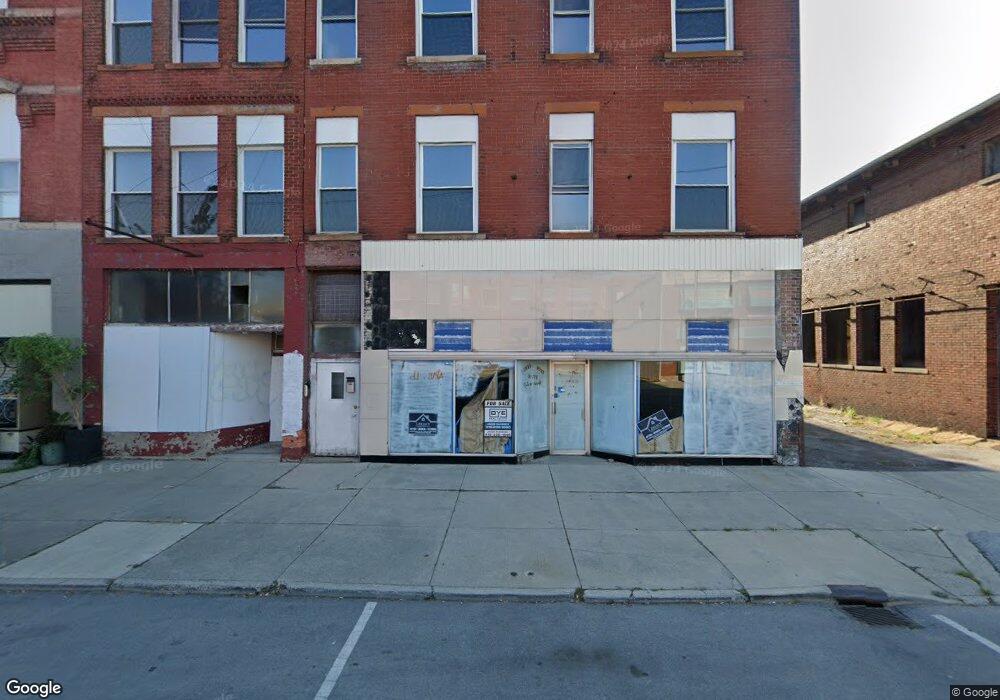
409 N Main St Lima, OH 45801
Eastside Lima NeighborhoodEstimated Value: $52,932
Studio
--
Bath
21,840
Sq Ft
$2/Sq Ft
Est. Value
About This Home
This home is located at 409 N Main St, Lima, OH 45801 and is currently estimated at $52,932, approximately $2 per square foot. 409 N Main St is a home located in Allen County with nearby schools including Independence Elementary School, Lima North Middle School, and Lima West Middle School.
Ownership History
Date
Name
Owned For
Owner Type
Purchase Details
Closed on
Jun 20, 2025
Sold by
Delish Homes Llc
Bought by
409 N Main Llc
Current Estimated Value
Home Financials for this Owner
Home Financials are based on the most recent Mortgage that was taken out on this home.
Original Mortgage
$50,894
Outstanding Balance
$50,765
Interest Rate
6.86%
Mortgage Type
Seller Take Back
Estimated Equity
$2,167
Purchase Details
Closed on
Feb 18, 2022
Sold by
Intelligent Rental Solutions Llc
Bought by
Delish Homes Llc
Purchase Details
Closed on
Sep 21, 2018
Sold by
Murphy Joshua D
Bought by
Intelligent Rental Solutions Llc
Purchase Details
Closed on
Jan 29, 2018
Sold by
Murphy David C
Bought by
Murphy Joshua D
Purchase Details
Closed on
Jan 30, 2012
Sold by
Halker Brad A and Halker Taneka N
Bought by
Murphy David C
Purchase Details
Closed on
Oct 2, 2007
Sold by
Murphy David C and Murphy Janice A
Bought by
Halker Brad A and Halker Taneka N
Purchase Details
Closed on
Apr 4, 2007
Sold by
Recker John E and Recker Kathleen P
Bought by
Murphy David C
Purchase Details
Closed on
Nov 5, 1996
Sold by
Wallenhorst David
Bought by
Recker John and Recker Kathleen
Purchase Details
Closed on
Oct 29, 1996
Sold by
Hunter Charles
Bought by
Recker John and Wallenhorst David
Purchase Details
Closed on
Oct 1, 1972
Bought by
Hunter Charles M
Create a Home Valuation Report for This Property
The Home Valuation Report is an in-depth analysis detailing your home's value as well as a comparison with similar homes in the area
Home Values in the Area
Average Home Value in this Area
Purchase History
| Date | Buyer | Sale Price | Title Company |
|---|---|---|---|
| 409 N Main Llc | $54,000 | None Listed On Document | |
| Delish Homes Llc | $60,000 | Richardson Law | |
| Intelligent Rental Solutions Llc | -- | None Available | |
| Murphy Joshua D | $20,000 | None Available | |
| Murphy David C | $15,000 | None Available | |
| Halker Brad A | $30,000 | None Available | |
| Murphy David C | $28,000 | None Available | |
| Recker John | $20,000 | -- | |
| Recker John | $51,000 | -- | |
| Hunter Charles M | $34,000 | -- |
Source: Public Records
Mortgage History
| Date | Status | Borrower | Loan Amount |
|---|---|---|---|
| Open | 409 N Main Llc | $50,894 |
Source: Public Records
Tax History
| Year | Tax Paid | Tax Assessment Tax Assessment Total Assessment is a certain percentage of the fair market value that is determined by local assessors to be the total taxable value of land and additions on the property. | Land | Improvement |
|---|---|---|---|---|
| 2024 | $1,739 | $9,070 | $6,300 | $2,770 |
| 2023 | $1,935 | $8,260 | $5,740 | $2,520 |
| 2022 | $743 | $8,260 | $5,740 | $2,520 |
| 2021 | $1,121 | $8,260 | $5,740 | $2,520 |
| 2020 | $698 | $7,810 | $5,740 | $2,070 |
| 2019 | $698 | $7,810 | $5,740 | $2,070 |
| 2018 | $690 | $7,810 | $5,740 | $2,070 |
| 2017 | $688 | $7,810 | $5,740 | $2,070 |
| 2016 | $696 | $7,810 | $5,740 | $2,070 |
| 2015 | $797 | $7,810 | $5,740 | $2,070 |
| 2014 | $797 | $9,770 | $5,740 | $4,030 |
| 2013 | $778 | $9,770 | $5,740 | $4,030 |
Source: Public Records
Map
Nearby Homes
- 325 N McDonel St
- 616-616.5 N Elizabeth St
- 631 Brice Ave
- 431 N Metcalf St
- 416 Hazel Ave
- 435 Marian Ave
- 129 S Pine St
- 145 S Pine St
- 745 Richie Ave
- 735 N Elizabeth St
- 555 Haller St
- 316 Ewing Ave
- 406 Ewing Ave
- 919 N Main St
- 934 N Metcalf St
- 417 S McDonel St
- 816 N Baxter St
- 922 N Jefferson St
- 508 N Collett St
- 631 Hazel Ave
- 409/411 Main N
- 401 N Main St
- 124 W Wayne St
- Four SFR Package
- 338 N Main St
- 447&449 Main St N
- 122 E Wayne St
- 312 N Main St
- 130 E Wayne St
- 215 W Wayne St
- 120 W North St
- 317 N Elizabeth St
- 216 W Wayne St
- 315 N Elizabeth Lease
- 315 N Elizabeth St
- 315 N Elizabeth St Unit 2
- 315 N Elizabeth St
- 311 N Elizabeth St
- 332 N West St
- 464 N Elizabeth St
Your Personal Tour Guide
Ask me questions while you tour the home.