41 Althea St Providence, RI 02907
West End NeighborhoodEstimated Value: $607,000 - $670,167
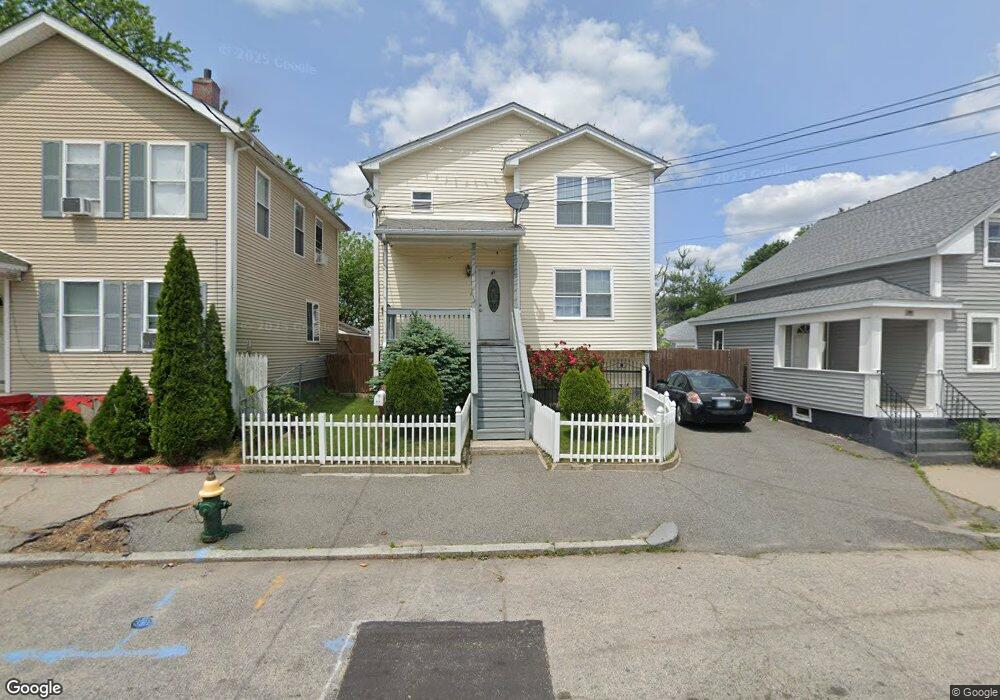
About This Home
This home is located at 41 Althea St, Providence, RI 02907 and is currently estimated at $633,292, approximately $229 per square foot. 41 Althea St is a home located in Providence County with nearby schools including Achievement First Iluminar Mayoral Academy, SouthSide Elementary Charter, and Achievement First Iluminar Mayoral Academy Middle School.
Ownership History
Purchase Details
Home Financials for this Owner
Home Financials are based on the most recent Mortgage that was taken out on this home.Purchase Details
Home Financials for this Owner
Home Financials are based on the most recent Mortgage that was taken out on this home.Home Values in the Area
Average Home Value in this Area
Purchase History
We collect this data history from publicly available records. To have your information removed, we recommend requesting removal directly through your county’s website.
| Date | Buyer | Sale Price | Title Company |
|---|---|---|---|
| Bulux Alfonso L | $335,000 | -- | |
| Delarosa Miguel | $70,000 | -- |
Mortgage History
We collect this data history from publicly available records. To have your information removed, we recommend requesting removal directly through your county’s website.
| Date | Status | Borrower | Loan Amount |
|---|---|---|---|
| Open | Delarosa Miguel | $335,000 | |
| Previous Owner | Delarosa Miguel | $252,150 |
Tax History
| Year | Tax Paid | Tax Assessment Tax Assessment Total Assessment is a certain percentage of the fair market value that is determined by local assessors to be the total taxable value of land and additions on the property. | Land | Improvement |
|---|---|---|---|---|
| 2025 | $4,349 | $576,000 | $108,000 | $468,000 |
| 2024 | $7,579 | $413,000 | $72,000 | $341,000 |
| 2023 | $7,579 | $413,000 | $72,000 | $341,000 |
| 2022 | $7,351 | $413,000 | $72,000 | $341,000 |
| 2021 | $6,494 | $264,400 | $33,600 | $230,800 |
| 2020 | $6,494 | $264,400 | $33,600 | $230,800 |
| 2019 | $6,494 | $264,400 | $33,600 | $230,800 |
| 2018 | $5,619 | $175,800 | $33,300 | $142,500 |
| 2017 | $5,619 | $175,800 | $33,300 | $142,500 |
| 2016 | $5,619 | $175,800 | $33,300 | $142,500 |
| 2015 | $5,097 | $154,000 | $33,300 | $120,700 |
| 2014 | $5,198 | $154,000 | $33,300 | $120,700 |
| 2013 | $5,198 | $154,000 | $33,300 | $120,700 |
Map
- 72 Ford St
- 33 Ford St
- 206 Hanover St
- 146 Althea St
- 102 Superior St
- 731 Potters Ave
- 161 Ford St
- 775 Potters Ave Unit 12
- 217 Elmwood Ave
- 26 Cromwell St
- 148 Superior St
- 654 Cranston St
- 45 Wendell St
- 59 Wendell St
- 98 Whitmarsh St
- 59 Warren St Unit 1
- 59 Warren St Unit 3
- 18 Calhoun Ave
- 24 Wood St Unit 2
- 71 Wilson St
Ask me questions while you tour the home.