41 Antwerp St Milton, MA 02186
Milton AreaEstimated Value: $932,000 - $1,158,000
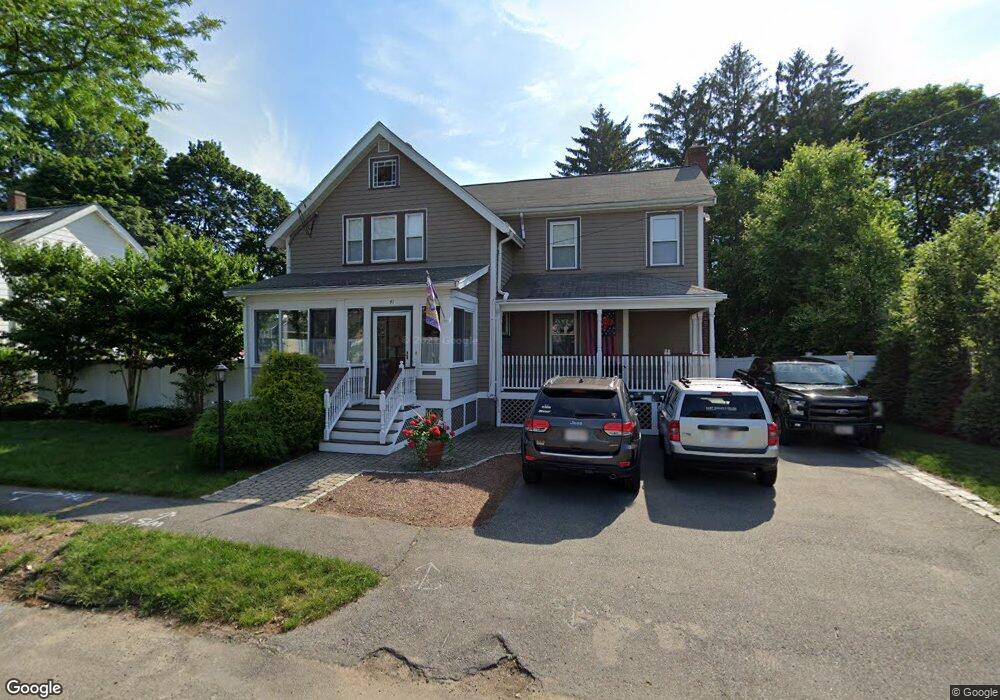
About This Home
This home is located at 41 Antwerp St, Milton, MA 02186 and is currently estimated at $1,062,291, approximately $466 per square foot. 41 Antwerp St is a home located in Norfolk County with nearby schools including Milton High School, Saint Agatha School, and Fontbonne Academy.
Ownership History
We collect this data history from publicly available records. To have your information removed, we recommend requesting removal directly through your county’s website.
Purchase Details
Purchase Details
Purchase History
We collect this data history from publicly available records. To have your information removed, we recommend requesting removal directly through your county’s website.
| Date | Buyer | Sale Price | Title Company |
|---|---|---|---|
| $179,900 | -- | ||
| $153,450 | -- |
Mortgage History
We collect this data history from publicly available records. To have your information removed, we recommend requesting removal directly through your county’s website.
| Date | Status | Borrower | Loan Amount |
|---|---|---|---|
| Open | $125,000 | ||
| Closed | $35,000 | ||
| Closed | $165,000 | ||
| Closed | $98,000 |
Tax History
We collect this data history from publicly available records. To have your information removed, we recommend requesting removal directly through your county’s website.
| Year | Tax Paid | Tax Assessment Tax Assessment Total Assessment is a certain percentage of the fair market value that is determined by local assessors to be the total taxable value of land and additions on the property. | Land | Improvement |
|---|---|---|---|---|
| 2025 | $9,673 | $872,200 | $468,100 | $404,100 |
| 2024 | $9,544 | $874,000 | $445,900 | $428,100 |
| 2023 | $9,473 | $831,000 | $424,900 | $406,100 |
| 2022 | $9,237 | $740,700 | $424,900 | $315,800 |
| 2021 | $8,876 | $676,000 | $375,300 | $300,700 |
| 2020 | $8,207 | $625,500 | $323,600 | $301,900 |
| 2019 | $8,006 | $607,400 | $314,200 | $293,200 |
| 2018 | $7,901 | $572,100 | $279,200 | $292,900 |
| 2017 | $7,394 | $545,300 | $265,900 | $279,400 |
| 2016 | $7,282 | $539,400 | $265,900 | $273,500 |
| 2015 | $7,204 | $516,800 | $243,300 | $273,500 |
Map
- 20 Rowe St
- 17 Duggan Ln
- 185 Hamilton Ave
- 25 Waldeck Rd
- 1200 Brook Rd
- 440 Granite Ave Unit 201
- 45 Foster Ln
- 73 Washington St
- 635 Adams St
- 24 Victory Ave
- 89 Ardell St
- 33 Bishop Rd Unit 33
- 40 Shirley St
- 580 Quarry St Unit 4
- 246 N Central Ave
- 60 Harriet Ave
- 135 Safford St
- 118 Connell St
- 141 Willard St Unit 8
- 115 W Squantum St Unit 803
Ask me questions while you tour the home.