41 Brown St Kennebunk, ME 04043
Estimated Value: $416,000 - $511,000
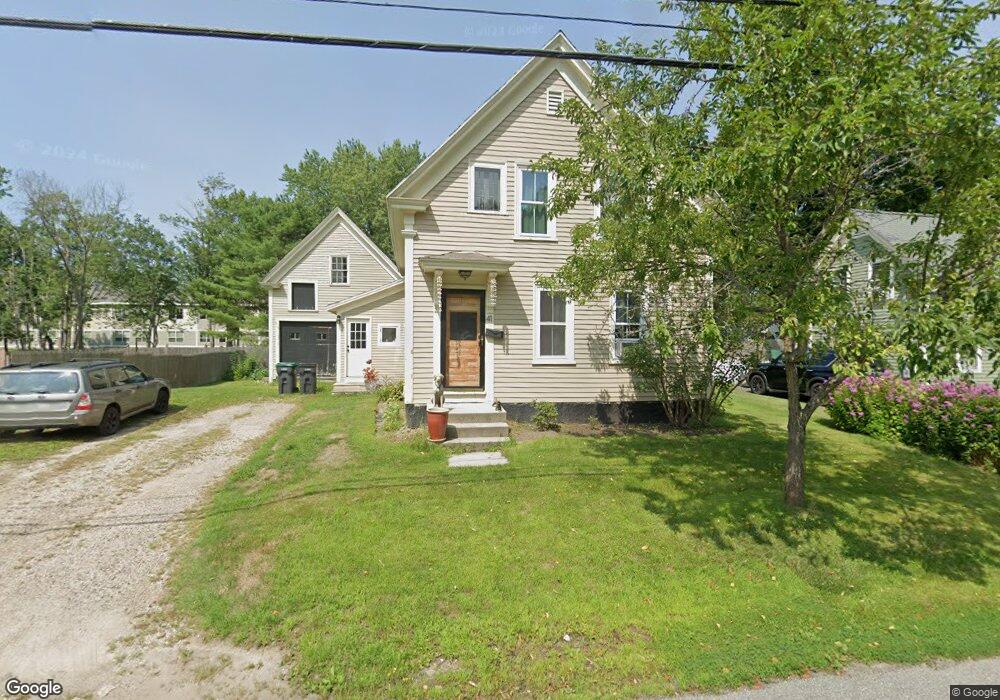
About This Home
This home is located at 41 Brown St, Kennebunk, ME 04043 and is currently estimated at $465,717, approximately $403 per square foot. 41 Brown St is a home located in York County with nearby schools including Kennebunk High School, School Around Us, and The New School.
Ownership History
We collect this data history from publicly available records. To have your information removed, we recommend requesting removal directly through your county’s website.
Purchase Details
Home Financials for this Owner
Home Financials are based on the most recent Mortgage that was taken out on this home.Home Values in the Area
Average Home Value in this Area
Purchase History
We collect this data history from publicly available records. To have your information removed, we recommend requesting removal directly through your county’s website.
| Date | Buyer | Sale Price | Title Company |
|---|---|---|---|
| -- | -- |
Mortgage History
We collect this data history from publicly available records. To have your information removed, we recommend requesting removal directly through your county’s website.
| Date | Status | Borrower | Loan Amount |
|---|---|---|---|
| Open | $93,500 |
Tax History
We collect this data history from publicly available records. To have your information removed, we recommend requesting removal directly through your county’s website.
| Year | Tax Paid | Tax Assessment Tax Assessment Total Assessment is a certain percentage of the fair market value that is determined by local assessors to be the total taxable value of land and additions on the property. | Land | Improvement |
|---|---|---|---|---|
| 2025 | $4,035 | $409,600 | $194,400 | $215,200 |
| 2024 | $3,539 | $208,800 | $74,700 | $134,100 |
| 2023 | $3,351 | $208,800 | $74,700 | $134,100 |
| 2022 | $3,048 | $208,800 | $74,700 | $134,100 |
| 2021 | $2,975 | $208,800 | $74,700 | $134,100 |
| 2020 | $2,955 | $208,800 | $74,700 | $134,100 |
| 2019 | $2,871 | $208,800 | $74,700 | $134,100 |
| 2018 | $2,741 | $156,600 | $56,000 | $100,600 |
| 2017 | $2,592 | $156,600 | $56,000 | $100,600 |
| 2016 | $2,490 | $156,600 | $56,000 | $100,600 |
| 2015 | $2,396 | $156,600 | $56,000 | $100,600 |
| 2014 | $2,333 | $156,600 | $56,000 | $100,600 |
Map
- 31 Brown St
- 1 Hall St
- 23 Chamberlain Way Unit 23
- 60 Brown St Unit 7
- 60 Brown St Unit 17
- 7 Water St
- 10 Webhannet Place Unit 1
- 24 Grove St Unit 24
- 7 Storer St
- 15 Webhannet Place Unit 10
- 22 Greenwich Way Unit 40
- 24 Cat Mousam Rd
- 93 Main St Unit A
- 15 Dane St
- 1 Creekside Ct Unit 1
- 12 Creekside Ct Unit 11
- 15 Creekside Ct Unit 8
- 9 Summer St
- 1 Boundary Way
- 1 Cider Mill Ln
Ask me questions while you tour the home.