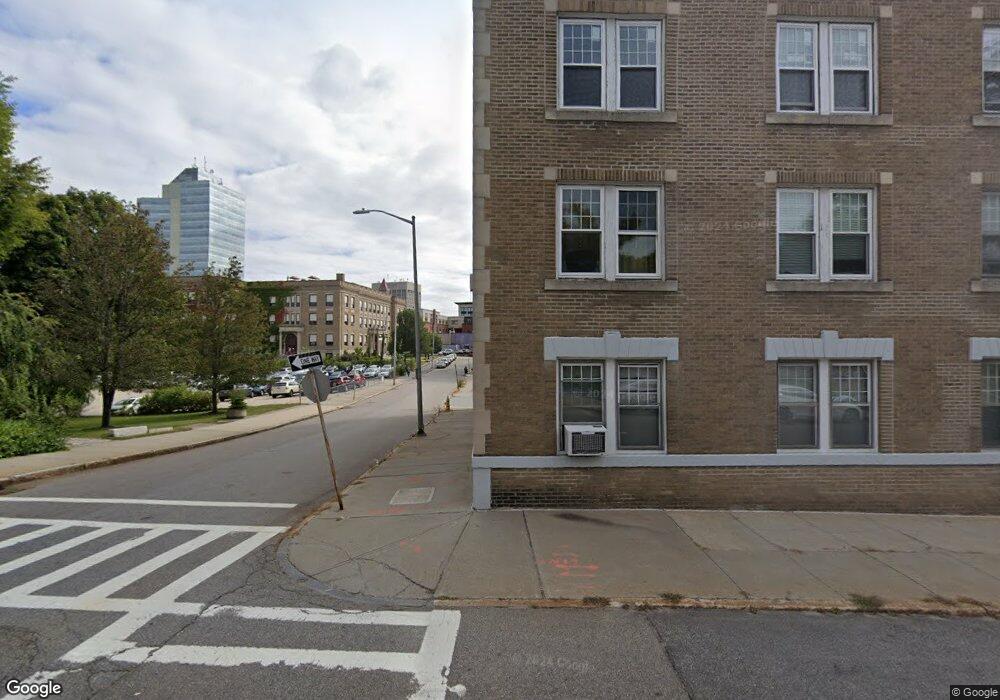
41 Chatham St Unit 6 Worcester, MA 01609
Elm Park NeighborhoodEstimated Value: $224,000 - $268,496
2
Beds
1
Bath
1,076
Sq Ft
$230/Sq Ft
Est. Value
About This Home
This home is located at 41 Chatham St Unit 6, Worcester, MA 01609 and is currently estimated at $247,624, approximately $230 per square foot. 41 Chatham St Unit 6 is a home located in Worcester County with nearby schools including Jacob Hiatt Magnet School, Chandler Magnet, and Elm Park Elementary School.
Ownership History
Date
Name
Owned For
Owner Type
Purchase Details
Closed on
Oct 28, 2004
Sold by
Eby Beth G and Eby Charles H
Bought by
Mercier George N
Current Estimated Value
Home Financials for this Owner
Home Financials are based on the most recent Mortgage that was taken out on this home.
Original Mortgage
$126,450
Outstanding Balance
$62,934
Interest Rate
5.74%
Mortgage Type
Purchase Money Mortgage
Estimated Equity
$184,690
Purchase Details
Closed on
Jul 20, 2000
Sold by
Dusman Linda J
Bought by
Cesarano James A
Home Financials for this Owner
Home Financials are based on the most recent Mortgage that was taken out on this home.
Original Mortgage
$40,500
Interest Rate
8.28%
Mortgage Type
Purchase Money Mortgage
Purchase Details
Closed on
Aug 25, 1989
Sold by
Kelley Thomas
Bought by
Dusman Linda
Create a Home Valuation Report for This Property
The Home Valuation Report is an in-depth analysis detailing your home's value as well as a comparison with similar homes in the area
Home Values in the Area
Average Home Value in this Area
Purchase History
We collect this data history from publicly available records. To have your information removed, we recommend requesting removal directly through your county’s website.
| Date | Buyer | Sale Price | Title Company |
|---|---|---|---|
| Mercier George N | $140,500 | -- | |
| Cesarano James A | $45,000 | -- | |
| Dusman Linda | $70,000 | -- |
Source: Public Records
Mortgage History
We collect this data history from publicly available records. To have your information removed, we recommend requesting removal directly through your county’s website.
| Date | Status | Borrower | Loan Amount |
|---|---|---|---|
| Open | Mercier George N | $126,450 | |
| Previous Owner | Dusman Linda | $16,900 | |
| Previous Owner | Dusman Linda | $66,000 | |
| Previous Owner | Dusman Linda | $40,500 |
Source: Public Records
Tax History
| Year | Tax Paid | Tax Assessment Tax Assessment Total Assessment is a certain percentage of the fair market value that is determined by local assessors to be the total taxable value of land and additions on the property. | Land | Improvement |
|---|---|---|---|---|
| 2025 | $3,055 | $231,600 | $0 | $231,600 |
| 2024 | $2,918 | $212,200 | $0 | $212,200 |
| 2023 | $2,600 | $181,300 | $0 | $181,300 |
| 2022 | $2,469 | $162,300 | $0 | $162,300 |
| 2021 | $2,256 | $138,600 | $0 | $138,600 |
| 2020 | $2,404 | $141,400 | $0 | $141,400 |
| 2019 | $1,827 | $101,500 | $0 | $101,500 |
| 2018 | $1,730 | $91,500 | $0 | $91,500 |
| 2017 | $1,864 | $97,000 | $0 | $97,000 |
| 2016 | $2,040 | $99,000 | $0 | $99,000 |
| 2015 | $1,987 | $99,000 | $0 | $99,000 |
| 2014 | $1,997 | $102,200 | $0 | $102,200 |
Source: Public Records
Map
Nearby Homes
- 4 Chatham Place Unit 3
- 34 Irving St
- 131 Pleasant St
- 12 Crown St
- 17 Federal St Unit 210
- 17 Federal St Unit 506
- 8 Ashland St Unit 8G
- 10 Ashland St Unit 2L
- 22 Elm St Unit 302
- 22 Elm St Unit 401
- 22 Elm St Unit 310
- 70 Southbridge St Unit 313
- 70 Southbridge St Unit 310
- 31 Chestnut St Unit 5
- 29 William St Unit 22
- 40 Merrick St Unit A
- 4 Preston St
- 15 Russell St
- 6 Pelham St
- 4 Home St
- 27 Irving St Unit 4
- 27 Irving St Unit 3
- 27 Irving St Unit 2
- 27 Irving St Unit 1
- 6 Chatham Place Unit 8
- 6 Chatham Place Unit 7
- 6 Chatham Place
- 6 Chatham Place Unit 5
- 6 Chatham Place Unit 4
- 6 Chatham Place Unit 3
- 6 Chatham Place Unit 2
- 6 Chatham Place Unit 1
- 4 Chatham Place
- 4 Chatham Place Unit 2
- 4 Chatham Place Unit 1
- 41 Chatham St Unit 8
- 41 Chatham St Unit 7
- 41 Chatham St Unit 5
- 41 Chatham St Unit 4
- 41 Chatham St Unit 3
Your Personal Tour Guide
Ask me questions while you tour the home.