41 Chipman Rd Sandwich, MA 02563
Estimated Value: $665,444 - $845,000
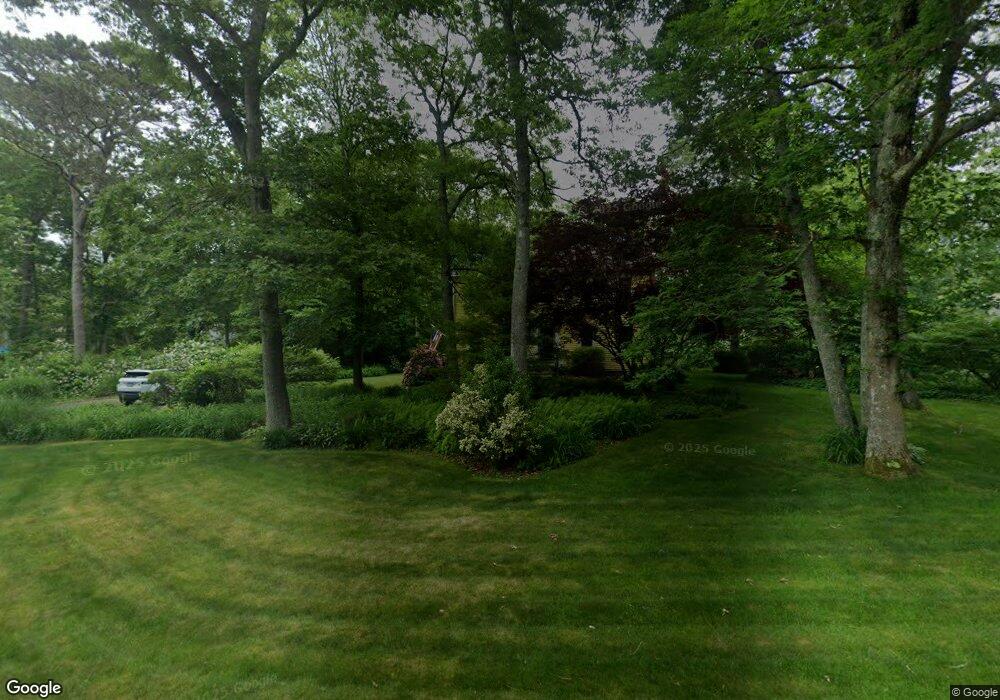
About This Home
This home is located at 41 Chipman Rd, Sandwich, MA 02563 and is currently estimated at $719,861, approximately $399 per square foot. 41 Chipman Rd is a home located in Barnstable County with nearby schools including Sandwich Middle High School, Waldorf School of Cape Cod, and Bridgeview Montessori School.
Ownership History
We collect this data history from publicly available records. To have your information removed, we recommend requesting removal directly through your county’s website.
Purchase Details
Purchase Details
Purchase History
We collect this data history from publicly available records. To have your information removed, we recommend requesting removal directly through your county’s website.
| Date | Buyer | Sale Price | Title Company |
|---|---|---|---|
| $192,000 | -- | ||
| $192,000 | -- | ||
| $171,500 | -- | ||
| $171,500 | -- |
Mortgage History
We collect this data history from publicly available records. To have your information removed, we recommend requesting removal directly through your county’s website.
| Date | Status | Borrower | Loan Amount |
|---|---|---|---|
| Open | $238,000 | ||
| Closed | $219,000 | ||
| Closed | $50,000 |
Tax History
We collect this data history from publicly available records. To have your information removed, we recommend requesting removal directly through your county’s website.
| Year | Tax Paid | Tax Assessment Tax Assessment Total Assessment is a certain percentage of the fair market value that is determined by local assessors to be the total taxable value of land and additions on the property. | Land | Improvement |
|---|---|---|---|---|
| 2025 | $5,482 | $518,600 | $205,300 | $313,300 |
| 2024 | $5,095 | $471,800 | $175,300 | $296,500 |
| 2023 | $4,977 | $432,800 | $159,400 | $273,400 |
| 2022 | $4,744 | $360,500 | $139,700 | $220,800 |
| 2021 | $4,550 | $330,400 | $133,700 | $196,700 |
| 2020 | $4,581 | $320,100 | $133,600 | $186,500 |
| 2019 | $4,469 | $312,100 | $137,200 | $174,900 |
| 2018 | $4,217 | $295,100 | $132,500 | $162,600 |
| 2017 | $4,183 | $280,200 | $128,200 | $152,000 |
| 2016 | $3,933 | $271,800 | $123,600 | $148,200 |
| 2015 | $3,868 | $261,000 | $114,300 | $146,700 |
Map
- 10 Royal Cir
- 3 Whiffletree Cir
- 9 Coach Ln
- 252 Route 6a
- 0 Ox Pasture Rd
- 306 Route 6a
- 306 Route 6a
- 200 Main St
- 3 Hilltop Dr Unit 3
- 34 Hilltop Dr
- 7 Hill Wood Way
- 21 Quaker Rd
- 83 Highview Dr Unit 83
- 3 Highview Dr Unit 3
- 3 Highview Dr Unit 3
- 6 Stonefield Dr
- 38 Grove St
- 143 Main St
- 12 Madison Dr
- 3 River St
Ask me questions while you tour the home.