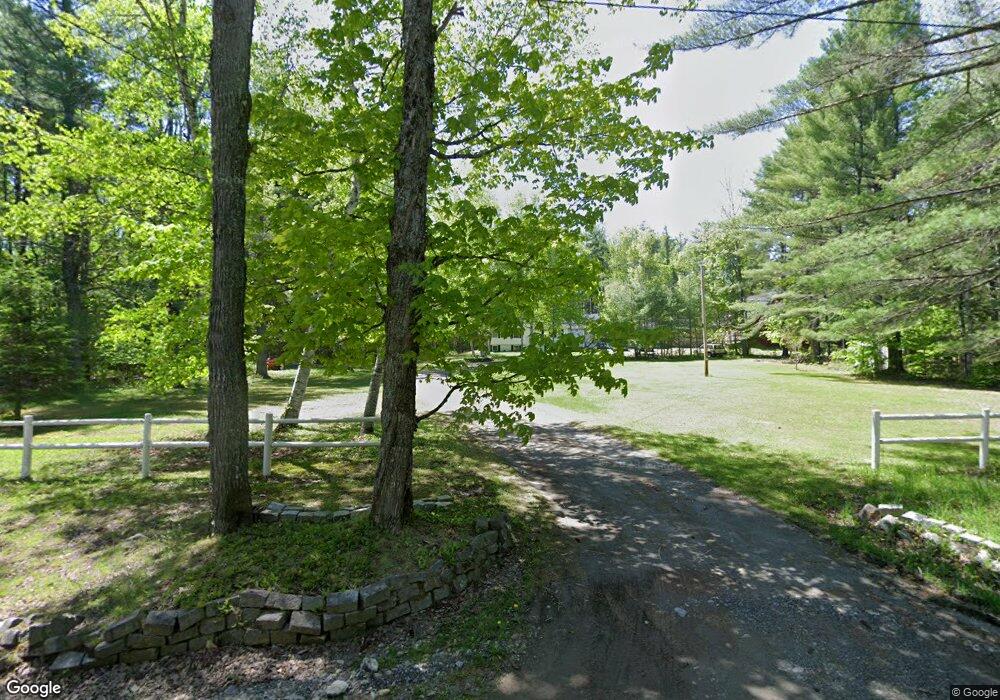
41 Dawes Rd Dover Foxcroft, ME 04426
Estimated Value: $212,000 - $366,000
3
Beds
1
Bath
960
Sq Ft
$323/Sq Ft
Est. Value
About This Home
This home is located at 41 Dawes Rd, Dover Foxcroft, ME 04426 and is currently estimated at $310,191, approximately $323 per square foot. 41 Dawes Rd is a home with nearby schools including Se Do Mo Cha Elementary School, Se Do Mo Cha Middle School, and Foxcroft Academy.
Ownership History
Date
Name
Owned For
Owner Type
Purchase Details
Closed on
Jan 19, 2005
Sold by
Robinson Ronald L
Bought by
Hewett Victor R
Current Estimated Value
Home Financials for this Owner
Home Financials are based on the most recent Mortgage that was taken out on this home.
Original Mortgage
$55,000
Interest Rate
7%
Mortgage Type
Adjustable Rate Mortgage/ARM
Create a Home Valuation Report for This Property
The Home Valuation Report is an in-depth analysis detailing your home's value as well as a comparison with similar homes in the area
Home Values in the Area
Average Home Value in this Area
Purchase History
| Date | Buyer | Sale Price | Title Company |
|---|---|---|---|
| Hewett Victor R | -- | -- |
Source: Public Records
Mortgage History
| Date | Status | Borrower | Loan Amount |
|---|---|---|---|
| Closed | Hewett Victor R | $55,000 |
Source: Public Records
Tax History
| Year | Tax Paid | Tax Assessment Tax Assessment Total Assessment is a certain percentage of the fair market value that is determined by local assessors to be the total taxable value of land and additions on the property. | Land | Improvement |
|---|---|---|---|---|
| 2025 | $4,377 | $259,000 | $35,200 | $223,800 |
| 2024 | $3,929 | $231,100 | $32,000 | $199,100 |
| 2023 | $3,513 | $189,400 | $29,500 | $159,900 |
| 2022 | $3,394 | $169,700 | $27,100 | $142,600 |
| 2021 | $3,483 | $162,000 | $24,600 | $137,400 |
| 2020 | $3,467 | $162,000 | $24,600 | $137,400 |
| 2019 | $3,059 | $142,300 | $24,600 | $117,700 |
| 2018 | $3,017 | $142,300 | $24,600 | $117,700 |
| 2017 | $2,974 | $142,300 | $24,600 | $117,700 |
| 2016 | $2,882 | $142,300 | $24,600 | $117,700 |
| 2015 | $2,647 | $142,300 | $24,600 | $117,700 |
| 2014 | $2,597 | $142,300 | $24,600 | $117,700 |
| 2013 | $2,092 | $118,500 | $24,600 | $93,900 |
Source: Public Records
Map
Nearby Homes
Your Personal Tour Guide
Ask me questions while you tour the home.