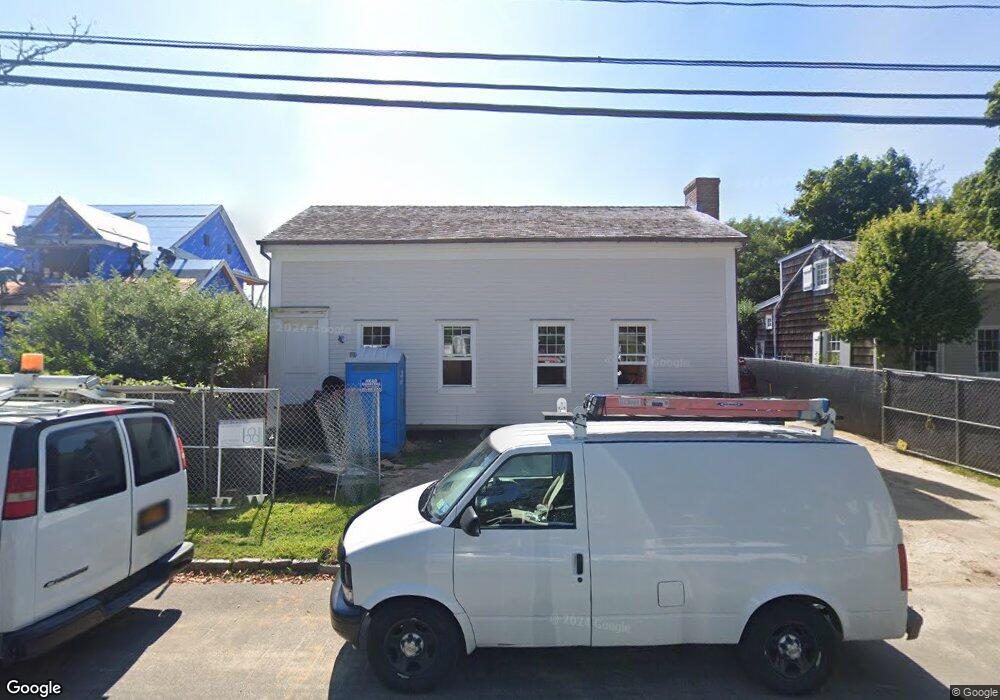
41 Glover St Sag Harbor, NY 11963
Estimated Value: $5,288,000 - $9,380,000
3
Beds
3
Baths
4,137
Sq Ft
$1,758/Sq Ft
Est. Value
About This Home
This home is located at 41 Glover St, Sag Harbor, NY 11963 and is currently estimated at $7,274,410, approximately $1,758 per square foot. 41 Glover St is a home located in Suffolk County with nearby schools including Sag Harbor Elementary School, Pierson Middle/High School, and Ross Lower School.
Ownership History
Date
Name
Owned For
Owner Type
Purchase Details
Closed on
Apr 27, 2015
Sold by
Ameringer William C
Bought by
Galesi Christina and Grant Stephen
Current Estimated Value
Purchase Details
Closed on
Jun 8, 2007
Sold by
Keller Scott
Bought by
Ameringer William C
Purchase Details
Closed on
Feb 20, 2002
Sold by
Butler Karina
Bought by
Keller Scott
Home Financials for this Owner
Home Financials are based on the most recent Mortgage that was taken out on this home.
Original Mortgage
$675,750
Interest Rate
6.5%
Mortgage Type
Purchase Money Mortgage
Purchase Details
Closed on
Mar 11, 1998
Sold by
Livingston Antoinette
Bought by
Butler Karina
Create a Home Valuation Report for This Property
The Home Valuation Report is an in-depth analysis detailing your home's value as well as a comparison with similar homes in the area
Home Values in the Area
Average Home Value in this Area
Purchase History
| Date | Buyer | Sale Price | Title Company |
|---|---|---|---|
| Galesi Christina | $3,087,500 | None Available | |
| Ameringer William C | $2,875,000 | Thomas Gazianis | |
| Keller Scott | $901,000 | Fidelity National Title Ins | |
| Butler Karina | $322,000 | Chicago Title Insurance Co |
Source: Public Records
Mortgage History
| Date | Status | Borrower | Loan Amount |
|---|---|---|---|
| Previous Owner | Keller Scott | $675,750 |
Source: Public Records
Tax History
| Year | Tax Paid | Tax Assessment Tax Assessment Total Assessment is a certain percentage of the fair market value that is determined by local assessors to be the total taxable value of land and additions on the property. | Land | Improvement |
|---|---|---|---|---|
| 2024 | $16,772 | $6,038,300 | $3,834,900 | $2,203,400 |
| 2023 | $45,341 | $5,398,600 | $3,834,900 | $1,563,700 |
| 2022 | $15,041 | $5,539,500 | $3,834,900 | $1,704,600 |
| 2021 | $13,865 | $5,074,600 | $3,834,900 | $1,239,700 |
| 2020 | $27,194 | $5,074,600 | $3,834,900 | $1,239,700 |
| 2019 | $33,829 | $0 | $0 | $0 |
| 2018 | -- | $3,008,400 | $1,994,200 | $1,014,200 |
| 2017 | $17,284 | $3,008,400 | $1,994,200 | $1,014,200 |
| 2016 | $17,976 | $3,008,400 | $1,994,200 | $1,014,200 |
| 2015 | -- | $1,960,100 | $1,704,400 | $255,700 |
| 2014 | -- | $1,960,100 | $1,704,400 | $255,700 |
Source: Public Records
Map
Nearby Homes
- 48 Garden St
- 338 Main St
- 120 Glover St
- 191 Main St
- 12 Suffolk St
- 9 Suffolk St
- 16 Redwood Rd
- 352 Main St
- 57 Jermain Ave
- 2 "B" W Water St
- 2 A W Water St
- 2 "A" W Water St
- 57 Palmer Terrace
- 1363 Brick Kiln Rd
- 12 Rose St
- 10 Bluff Point Ln
- 2 W Water St
- 15 Church St
- 15 Church St Unit G-122
- 15 Church St Unit PH320
Your Personal Tour Guide
Ask me questions while you tour the home.