41 Grenwold Rd Quincy, MA 02169
Quincy Center NeighborhoodEstimated Value: $991,675 - $1,273,000
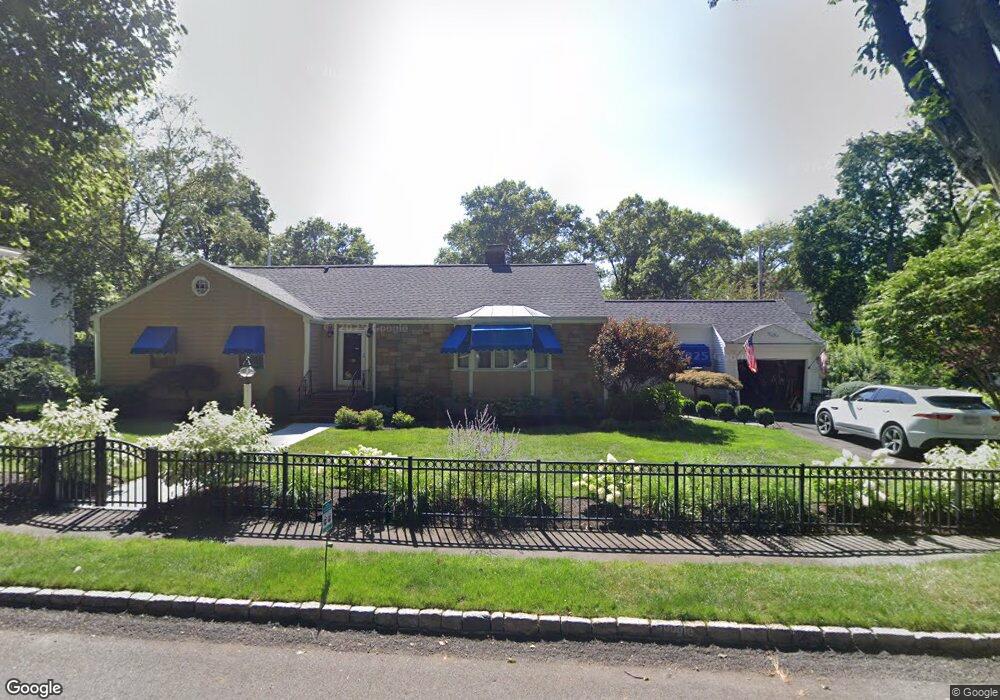
About This Home
This home is located at 41 Grenwold Rd, Quincy, MA 02169 and is currently estimated at $1,155,169, approximately $439 per square foot. 41 Grenwold Rd is a home located in Norfolk County with nearby schools including Charles A. Bernazzani Elementary School, Central Middle School, and Quincy High School.
Ownership History
We collect this data history from publicly available records. To have your information removed, we recommend requesting removal directly through your county’s website.
Purchase Details
Purchase Details
Home Values in the Area
Average Home Value in this Area
Purchase History
We collect this data history from publicly available records. To have your information removed, we recommend requesting removal directly through your county’s website.
| Date | Buyer | Sale Price | Title Company |
|---|---|---|---|
| -- | -- | ||
| -- | -- | ||
| -- | -- |
Mortgage History
We collect this data history from publicly available records. To have your information removed, we recommend requesting removal directly through your county’s website.
| Date | Status | Borrower | Loan Amount |
|---|---|---|---|
| Previous Owner | $150,000 |
Tax History
We collect this data history from publicly available records. To have your information removed, we recommend requesting removal directly through your county’s website.
| Year | Tax Paid | Tax Assessment Tax Assessment Total Assessment is a certain percentage of the fair market value that is determined by local assessors to be the total taxable value of land and additions on the property. | Land | Improvement |
|---|---|---|---|---|
| 2025 | $9,661 | $837,900 | $318,000 | $519,900 |
| 2024 | $9,052 | $803,200 | $303,400 | $499,800 |
| 2023 | $9,429 | $847,200 | $276,800 | $570,400 |
| 2022 | $10,039 | $838,000 | $252,600 | $585,400 |
| 2021 | $9,901 | $815,600 | $252,600 | $563,000 |
| 2020 | $10,293 | $828,100 | $241,000 | $587,100 |
| 2019 | $9,335 | $743,800 | $228,000 | $515,800 |
| 2018 | $9,645 | $723,000 | $228,000 | $495,000 |
| 2017 | $9,004 | $635,400 | $217,700 | $417,700 |
| 2016 | $8,501 | $592,000 | $207,800 | $384,200 |
| 2015 | $8,385 | $574,300 | $207,800 | $366,500 |
| 2014 | $7,654 | $515,100 | $198,400 | $316,700 |
Map
- 122 Puritan Dr
- 200 Adams St
- 308 Quarry St Unit 405
- 165 Whitwell St
- 45 Oval Rd Unit 34
- 45 Oval Rd Unit 8
- 183 Whitwell St
- 30 Hillside Ave
- 999 Hancock St Unit 502
- 18 Jenness St
- 77 Adams St Unit 611
- 77 Adams St Unit 610
- 77 Adams St Unit 1102
- 1025 Hancock St Unit 14F
- 1025 Hancock St Unit 2P
- 250 Whitwell St Unit 2
- 43 Dixwell Ave
- 154 Glendale Rd Unit 2
- 148 Presidents Ln Unit 1
- 148 Presidents Ln Unit 4
Ask me questions while you tour the home.