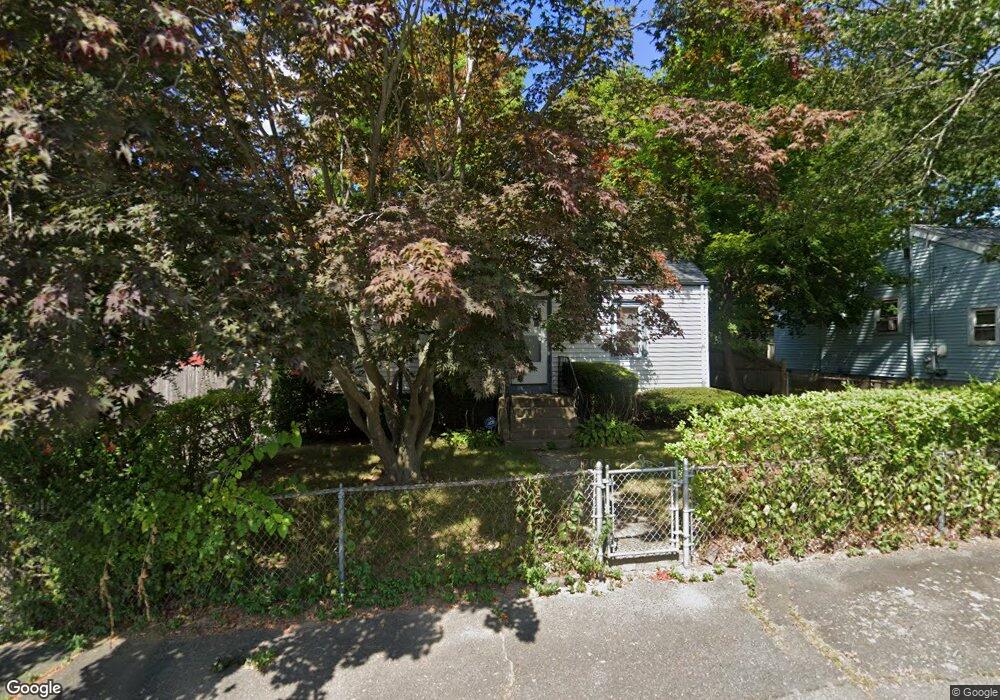
41 Hall St Randolph, MA 02368
North Randolph NeighborhoodEstimated Value: $508,000 - $562,000
3
Beds
1
Bath
1,170
Sq Ft
$461/Sq Ft
Est. Value
About This Home
This home is located at 41 Hall St, Randolph, MA 02368 and is currently estimated at $539,932, approximately $461 per square foot. 41 Hall St is a home located in Norfolk County with nearby schools including Randolph High School and Thayer Academy.
Ownership History
Date
Name
Owned For
Owner Type
Purchase Details
Closed on
Feb 25, 2001
Sold by
Quealy Tr Matthew and Quealy Christopher
Bought by
Ware David
Current Estimated Value
Home Financials for this Owner
Home Financials are based on the most recent Mortgage that was taken out on this home.
Original Mortgage
$189,860
Interest Rate
6.89%
Mortgage Type
Purchase Money Mortgage
Create a Home Valuation Report for This Property
The Home Valuation Report is an in-depth analysis detailing your home's value as well as a comparison with similar homes in the area
Home Values in the Area
Average Home Value in this Area
Purchase History
We collect this data history from publicly available records. To have your information removed, we recommend requesting removal directly through your county’s website.
| Date | Buyer | Sale Price | Title Company |
|---|---|---|---|
| Ware David | $196,900 | -- |
Source: Public Records
Mortgage History
We collect this data history from publicly available records. To have your information removed, we recommend requesting removal directly through your county’s website.
| Date | Status | Borrower | Loan Amount |
|---|---|---|---|
| Open | Ware David | $153,750 | |
| Closed | Ware David | $100,000 | |
| Closed | Ware David | $189,860 |
Source: Public Records
Tax History
| Year | Tax Paid | Tax Assessment Tax Assessment Total Assessment is a certain percentage of the fair market value that is determined by local assessors to be the total taxable value of land and additions on the property. | Land | Improvement |
|---|---|---|---|---|
| 2025 | $5,121 | $441,100 | $218,300 | $222,800 |
| 2024 | $4,956 | $432,800 | $214,100 | $218,700 |
| 2023 | $4,764 | $394,400 | $194,600 | $199,800 |
| 2022 | $4,765 | $350,400 | $162,100 | $188,300 |
| 2021 | $4,441 | $300,500 | $135,100 | $165,400 |
| 2020 | $4,342 | $291,200 | $135,100 | $156,100 |
| 2019 | $4,125 | $275,400 | $128,700 | $146,700 |
| 2018 | $4,005 | $252,200 | $117,000 | $135,200 |
| 2017 | $3,917 | $242,100 | $109,100 | $133,000 |
| 2016 | $3,761 | $216,300 | $99,200 | $117,100 |
| 2015 | $3,680 | $203,300 | $94,400 | $108,900 |
Source: Public Records
Map
Nearby Homes
- 32 Hills St
- 13 Wordsworth St
- 9 Denise Dr
- 5 Oliver St
- 304 High St
- 36 Sarah St
- 1 Royal Crest Dr Unit 3
- 93 Morgan St
- 71 Rockefeller St
- 232 Canton St Unit 308
- 232 Canton St Unit 107
- 232 Canton St Unit 112
- 232 Canton St Unit 104
- 232 Canton St Unit 206
- 12 Howard Ave
- 17 Norroway Ave
- 6 Sunset Dr
- 60 Pond Ln
- 1707 Irving Rd
- 1603 Irving Rd
Your Personal Tour Guide
Ask me questions while you tour the home.