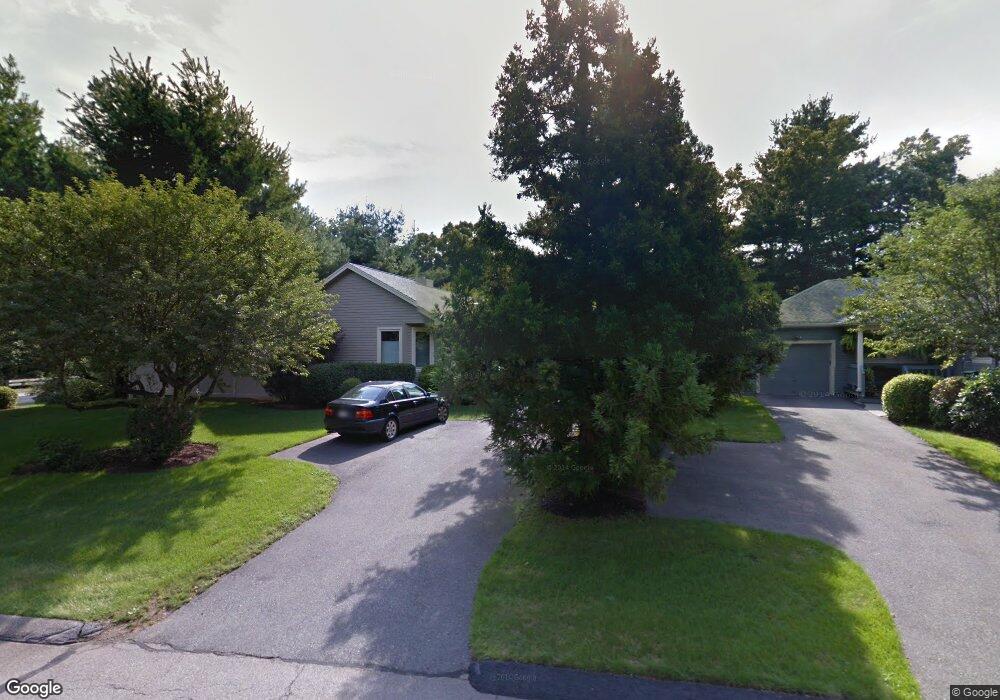
41 Independence Dr Foxboro, MA 02035
Foxborough AreaEstimated Value: $533,000 - $605,000
About This Home
This home is located at 41 Independence Dr, Foxboro, MA 02035 and is currently estimated at $573,680, approximately $376 per square foot. 41 Independence Dr is a home located in Norfolk County with nearby schools including Foxborough High School, Foxborough Regional Charter School, and The Sage School.
Ownership History
We collect this data history from publicly available records. To have your information removed, we recommend requesting removal directly through your county’s website.
Purchase Details
Purchase Details
Purchase Details
Home Values in the Area
Average Home Value in this Area
Purchase History
We collect this data history from publicly available records. To have your information removed, we recommend requesting removal directly through your county’s website.
| Date | Buyer | Sale Price | Title Company |
|---|---|---|---|
| $375,000 | -- | ||
| $301,000 | -- | ||
| $234,865 | -- |
Mortgage History
We collect this data history from publicly available records. To have your information removed, we recommend requesting removal directly through your county’s website.
| Date | Status | Borrower | Loan Amount |
|---|---|---|---|
| Open | $300,000 | ||
| Previous Owner | $275,000 | ||
| Previous Owner | $262,000 | ||
| Previous Owner | $160,000 |
Tax History
We collect this data history from publicly available records. To have your information removed, we recommend requesting removal directly through your county’s website.
| Year | Tax Paid | Tax Assessment Tax Assessment Total Assessment is a certain percentage of the fair market value that is determined by local assessors to be the total taxable value of land and additions on the property. | Land | Improvement |
|---|---|---|---|---|
| 2025 | $7,209 | $545,300 | $0 | $545,300 |
| 2024 | $7,097 | $525,300 | $0 | $525,300 |
| 2023 | $6,511 | $458,200 | $0 | $458,200 |
| 2022 | $6,662 | $458,800 | $0 | $458,800 |
| 2021 | $6,562 | $445,200 | $0 | $445,200 |
| 2020 | $5,749 | $394,600 | $0 | $394,600 |
| 2019 | $5,855 | $398,300 | $0 | $398,300 |
| 2018 | $5,556 | $381,300 | $0 | $381,300 |
| 2017 | $4,914 | $326,700 | $0 | $326,700 |
| 2016 | $4,276 | $288,500 | $0 | $288,500 |
| 2015 | $3,989 | $262,600 | $0 | $262,600 |
| 2014 | $3,936 | $262,600 | $0 | $262,600 |
Map
- 42 Cannon Forge Dr
- 9 Grover Ln
- 160 East St
- 11 Firebrick Rd
- 19 Windsor Dr
- 25 Sullivan Way
- 12 Iron Hollow Rd
- 84 Cannon Ball Rd
- 31 Atherton Rd
- 3 Windsor Dr
- 4 Solstice Way
- 165 Chestnut St Unit 2
- 11 Windsor Dr
- 161 Chestnut St Unit C
- 112 Cocasset St Unit 3
- Lot One Old Wolomolopoag St
- Lot Two Old Wolomolopoag St
- 11 W Belcher Rd Unit 6
- 8 Weyman Ln
- 84 Cocasset St Unit B2
- 39 Independence Dr
- 37 Independence Dr
- 37 Independence Dr Unit 1
- 1 Independence Dr
- 3 Independence Dr
- 35 Independence Dr
- 35 Independence Dr Unit 35-35
- 5 Independence Dr
- 5 Independence Dr Unit 5
- 10 Independence Dr
- 31 Independence Dr
- 33 Independence Dr
- 33 Independence Dr Unit 33
- 7 Independence Dr
- 7 Independence Dr Unit M7
- 2 Independence Dr
- 8 Independence Dr
- 8 Independence Dr Unit 8,8
- 8 Independence Dr Unit R-8
- 9 Independence Dr
Ask me questions while you tour the home.