41 Johnson St Lynn, MA 01902
Central Lynn NeighborhoodEstimated Value: $644,000 - $985,000
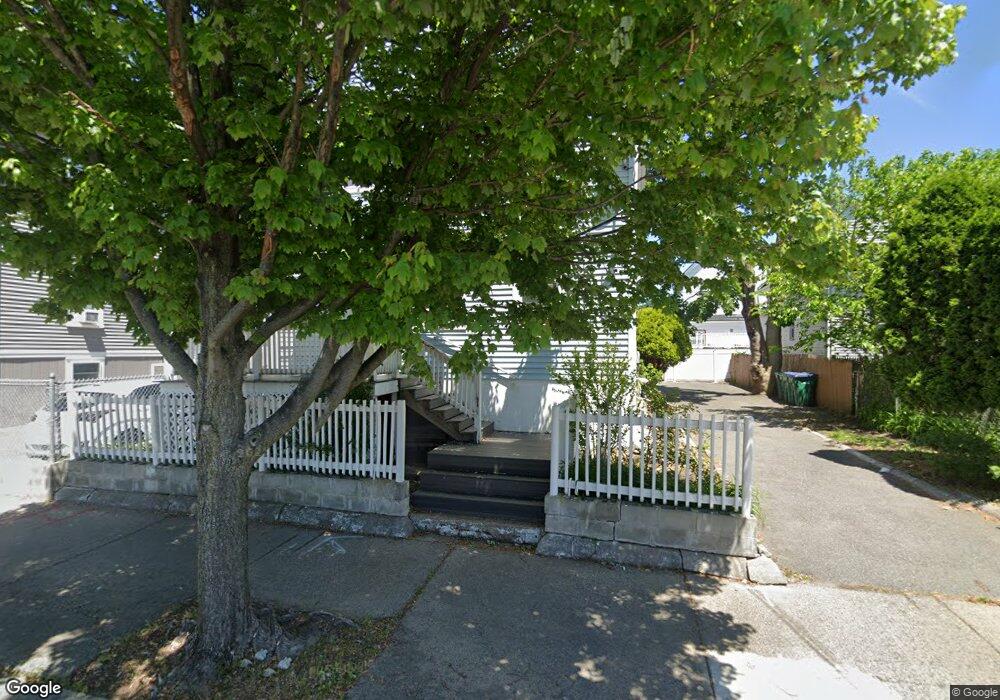
About This Home
This home is located at 41 Johnson St, Lynn, MA 01902 and is currently estimated at $768,643, approximately $353 per square foot. 41 Johnson St is a home located in Essex County with nearby schools including Cobbet Elementary School, William R. Fallon School, and Fecteau-Leary Junior/Senior High School.
Ownership History
We collect this data history from publicly available records. To have your information removed, we recommend requesting removal directly through your county’s website.
Purchase Details
Home Values in the Area
Average Home Value in this Area
Purchase History
We collect this data history from publicly available records. To have your information removed, we recommend requesting removal directly through your county’s website.
| Date | Buyer | Sale Price | Title Company |
|---|---|---|---|
| $178,500 | -- | ||
| $178,500 | -- |
Mortgage History
We collect this data history from publicly available records. To have your information removed, we recommend requesting removal directly through your county’s website.
| Date | Status | Borrower | Loan Amount |
|---|---|---|---|
| Open | $188,200 | ||
| Closed | $7,468 |
Tax History
We collect this data history from publicly available records. To have your information removed, we recommend requesting removal directly through your county’s website.
| Year | Tax Paid | Tax Assessment Tax Assessment Total Assessment is a certain percentage of the fair market value that is determined by local assessors to be the total taxable value of land and additions on the property. | Land | Improvement |
|---|---|---|---|---|
| 2025 | $7,268 | $701,540 | $195,400 | $506,140 |
| 2024 | $6,920 | $657,200 | $188,500 | $468,700 |
| 2023 | $6,517 | $584,500 | $148,500 | $436,000 |
| 2022 | $6,692 | $538,400 | $134,200 | $404,200 |
| 2021 | $6,245 | $479,300 | $119,000 | $360,300 |
| 2020 | $5,800 | $432,800 | $112,000 | $320,800 |
| 2019 | $5,474 | $382,800 | $94,700 | $288,100 |
| 2018 | $5,106 | $337,000 | $93,800 | $243,200 |
| 2017 | $4,883 | $313,000 | $82,500 | $230,500 |
| 2016 | $4,299 | $265,700 | $62,100 | $203,600 |
| 2015 | $4,017 | $239,800 | $59,100 | $180,700 |
Map
- 9 Hamilton Ave
- 40 Hamilton Ave
- 52 Hamilton Ave
- 105 Lawton Ave
- 16 Mount Hood Terrace Unit 7
- 48 High Rock St Unit 1
- 51 High Rock St
- 49 Laighton St Unit 4
- 108 Franklin St
- 43 High Rock St
- 38 High Rock St
- 199 Allen Ave
- 137 Franklin St
- 20 Bellair St Unit A
- 42 Baker St
- 502 Western Ave
- 17 Acorn St
- 170 Oxford St Unit 504
- 55 Harwood St
- 449 Western Ave
- 15 Whittier St Unit 1
- 15 Whittier St
- 17 Whittier St
- 13 Whittier St
- 19 Whittier St
- 19 Whittier St Unit 1
- 19 Whittier St Unit 2
- 191 Washington St Unit 193
- 23 Whittier St
- 195 Washington St
- 14 Whittier St
- 16 Whittier St Unit 18
- 18 Whittier St Unit 1
- 16 Whittier St Unit 1
- 10 Whittier St
- 10 Whittier St Unit 2
- 197 Washington St Unit 2
- 197 Washington St
- 183 Washington St
- 183 Washington St Unit 5
Ask me questions while you tour the home.