41 Johnson St Millbury, MA 01527
Estimated Value: $496,000 - $539,000
About This Home
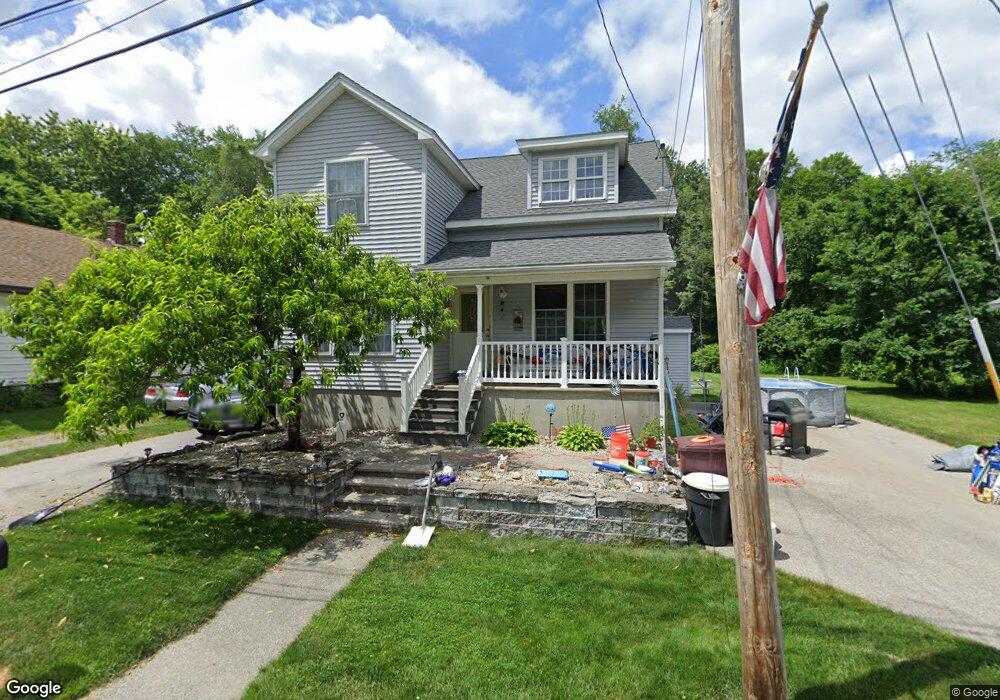
This home is located at 41 Johnson St, Millbury, MA 01527 and is currently estimated at $519,945, approximately $308 per square foot. 41 Johnson St is a home located in Worcester County with nearby schools including Elmwood Street Elementary School, Raymond E. Shaw Elementary School, and Millbury Junior/Senior High School.
Ownership History
We collect this data history from publicly available records. To have your information removed, we recommend requesting removal directly through your county’s website.
Purchase Details
Home Values in the Area
Average Home Value in this Area
Purchase History
We collect this data history from publicly available records. To have your information removed, we recommend requesting removal directly through your county’s website.
| Date | Buyer | Sale Price | Title Company |
|---|---|---|---|
| $15,000 | -- | ||
| $15,000 | -- |
Mortgage History
We collect this data history from publicly available records. To have your information removed, we recommend requesting removal directly through your county’s website.
| Date | Status | Borrower | Loan Amount |
|---|---|---|---|
| Previous Owner | $25,000 |
Tax History
We collect this data history from publicly available records. To have your information removed, we recommend requesting removal directly through your county’s website.
| Year | Tax Paid | Tax Assessment Tax Assessment Total Assessment is a certain percentage of the fair market value that is determined by local assessors to be the total taxable value of land and additions on the property. | Land | Improvement |
|---|---|---|---|---|
| 2025 | $6,071 | $453,400 | $111,000 | $342,400 |
| 2024 | $5,551 | $419,600 | $102,800 | $316,800 |
| 2023 | $4,929 | $341,100 | $72,100 | $269,000 |
| 2022 | $4,926 | $328,400 | $72,100 | $256,300 |
| 2021 | $4,578 | $296,700 | $72,100 | $224,600 |
| 2020 | $4,484 | $292,500 | $72,100 | $220,400 |
| 2019 | $4,535 | $286,100 | $71,800 | $214,300 |
| 2018 | $7,006 | $270,100 | $71,800 | $198,300 |
| 2017 | $3,907 | $237,800 | $71,800 | $166,000 |
| 2016 | $6,383 | $234,000 | $71,800 | $162,200 |
| 2015 | $3,723 | $226,200 | $73,000 | $153,200 |
| 2014 | $4,001 | $234,000 | $76,300 | $157,700 |
Map
- 11 Park Hill Rd
- 12 Cliff St
- 10 Logan's Run Unit 10
- 12 Logans Run Unit 80
- 44 Logans Run Unit 44
- 1 Rose Ln
- 8 Alstead Path
- 8 Millbury Terrace
- 557 SW Cutoff Unit 135
- 557 SW Cutoff Unit 140
- 557 SW Cutoff Unit 17
- 49 Strasburg Rd
- 16 Svenson Ave
- 2 Wilson Rd Unit B
- 166 Millbury Ave
- 23 Upton St
- 2 Kosta St
- 29 Tatman St
- 479 Massasoit Rd
- 121 Millbury Ave
- 43 Johnson St
- 37 Johnson St
- 40 Johnson St
- 44 Johnson St
- 38 Johnson St
- 138 Park Hill Ave
- 136 Park Hill Ave
- 140 Park Hill Ave
- 134 Park Hill Ave
- 142 Park Hill Ave
- 130 Park Hill Ave
- 126 Park Hill Ave
- 144 Park Hill Ave
- 137 Park Hill Ave
- 135 Park Hill Ave
- 133 Park Hill Ave
- 139 Park Hill Ave
- 129 Park Hill Ave
- 124 Park Hill Ave
- 145 Park Hill Ave
Ask me questions while you tour the home.