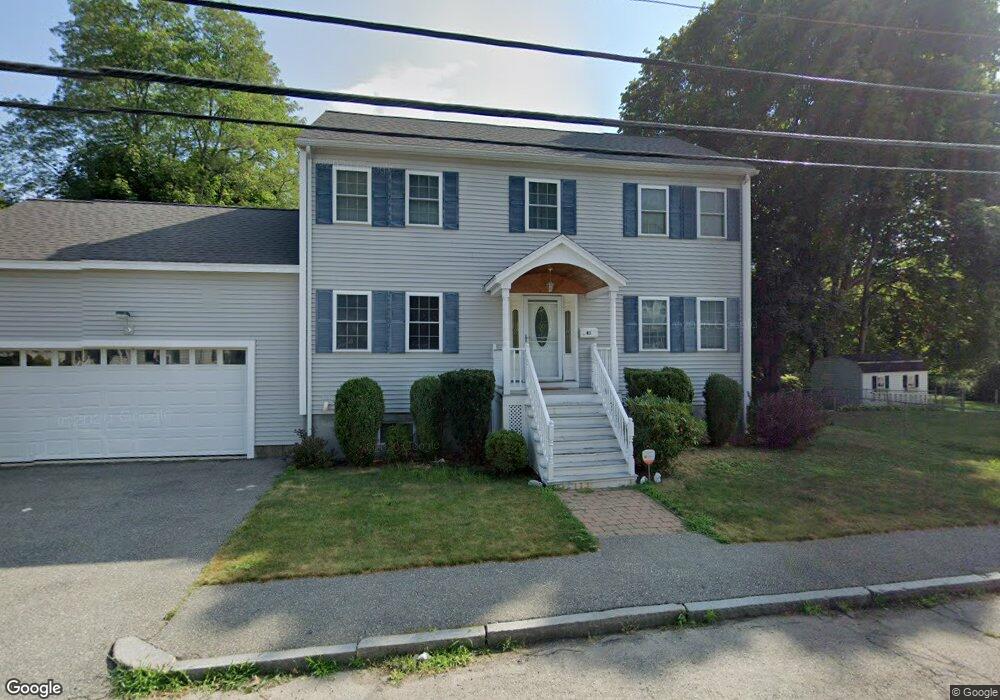
41 N Warren St Woburn, MA 01801
Downtown Woburn NeighborhoodEstimated Value: $874,000 - $952,000
4
Beds
3
Baths
1,900
Sq Ft
$480/Sq Ft
Est. Value
About This Home
This home is located at 41 N Warren St, Woburn, MA 01801 and is currently estimated at $911,989, approximately $479 per square foot. 41 N Warren St is a home located in Middlesex County with nearby schools including Hurld Elementary School, Daniel L. Joyce Middle School, and Woburn High School.
Ownership History
Date
Name
Owned For
Owner Type
Purchase Details
Closed on
Nov 30, 2005
Sold by
Detomasi Marie L and Demacedo Susan
Bought by
Deluca Linda E and Ballard Neil M
Current Estimated Value
Home Financials for this Owner
Home Financials are based on the most recent Mortgage that was taken out on this home.
Original Mortgage
$359,600
Outstanding Balance
$199,402
Interest Rate
6.14%
Mortgage Type
Purchase Money Mortgage
Estimated Equity
$712,587
Create a Home Valuation Report for This Property
The Home Valuation Report is an in-depth analysis detailing your home's value as well as a comparison with similar homes in the area
Home Values in the Area
Average Home Value in this Area
Purchase History
We collect this data history from publicly available records. To have your information removed, we recommend requesting removal directly through your county’s website.
| Date | Buyer | Sale Price | Title Company |
|---|---|---|---|
| Deluca Linda E | $509,000 | -- | |
| Deluca Linda E | $509,000 | -- |
Source: Public Records
Mortgage History
We collect this data history from publicly available records. To have your information removed, we recommend requesting removal directly through your county’s website.
| Date | Status | Borrower | Loan Amount |
|---|---|---|---|
| Open | Deluca Linda E | $359,600 | |
| Closed | Deluca Linda E | $359,600 |
Source: Public Records
Tax History
| Year | Tax Paid | Tax Assessment Tax Assessment Total Assessment is a certain percentage of the fair market value that is determined by local assessors to be the total taxable value of land and additions on the property. | Land | Improvement |
|---|---|---|---|---|
| 2025 | $6,901 | $808,100 | $309,000 | $499,100 |
| 2024 | $6,205 | $769,800 | $294,300 | $475,500 |
| 2023 | $6,053 | $695,700 | $267,600 | $428,100 |
| 2022 | $6,011 | $643,600 | $232,800 | $410,800 |
| 2021 | $5,779 | $619,400 | $221,800 | $397,600 |
| 2020 | $5,547 | $595,200 | $221,800 | $373,400 |
| 2019 | $5,331 | $561,200 | $211,300 | $349,900 |
| 2018 | $5,098 | $515,500 | $194,000 | $321,500 |
| 2017 | $5,046 | $507,600 | $184,800 | $322,800 |
| 2016 | $4,832 | $480,800 | $172,800 | $308,000 |
| 2015 | $4,674 | $459,600 | $161,500 | $298,100 |
| 2014 | $4,514 | $432,400 | $161,500 | $270,900 |
Source: Public Records
Map
Nearby Homes
- 17 Grove St
- 87 Winn St Unit 1
- 27 Park St
- 11 Beacon St
- 22 Franklin St
- 22 Scott St
- 31 Arlington Rd Unit 1-6
- 477 Main St
- 7 Prospect St
- 28 Everett St
- 31 Montvale Ave Unit 2
- 44 Warren Ave Unit B
- 35 Montvale Ave Unit 3
- 14 Church Ave
- 6 Richmond Park
- 166 Place Ln Unit 166
- 12 Linden St
- 201 Main St Unit 31
- 112 Burlington St
- 2 Cpl Charles J McMahon Dr
- 45 N Warren St
- 51 N Warren St
- 38 N Warren St
- 38 N Warren St Unit 38
- 34 N Warren St
- 40 Harrison Ave
- 30 N Warren St
- 55 Ellis St
- 39 N Warren St
- 49 Ellis St
- 48 Ellis St
- 28 N Warren St
- 42 Harrison Ave
- 35 Harrison Ave
- 39 Harrison Ave
- 41 Harrison Ave Unit 41
- 41 Harrison Ave Unit 1
- 47 Ellis St
- 33 Harrison Ave
- 33 Harrison Ave Unit Rear
Your Personal Tour Guide
Ask me questions while you tour the home.