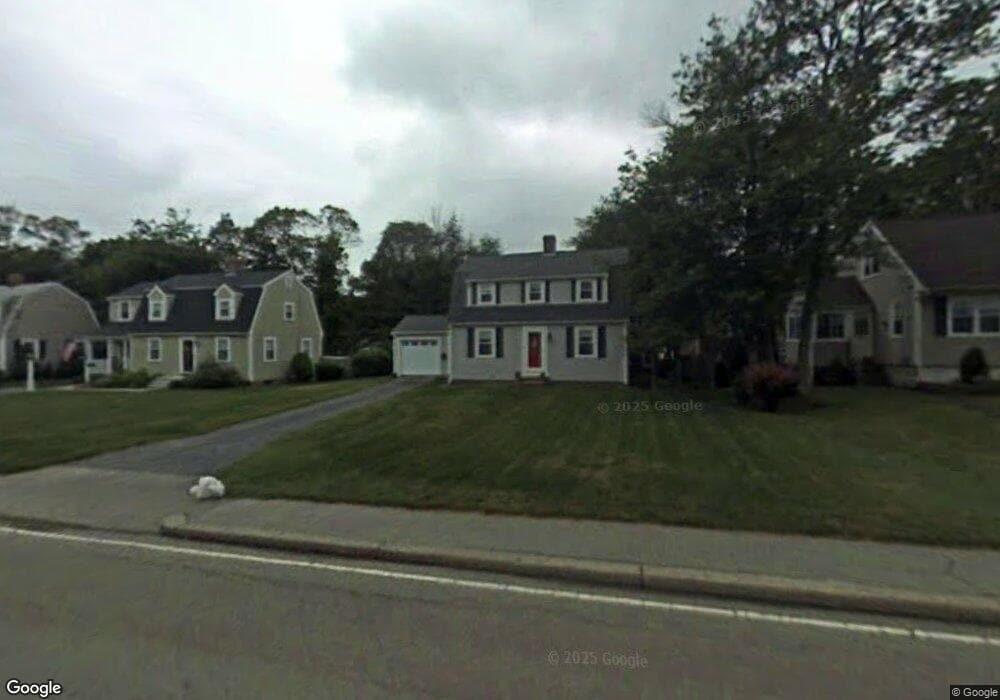
41 Spring St Weymouth, MA 02188
Weymouth Landing NeighborhoodEstimated Value: $566,274 - $665,000
About This Home
This home is located at 41 Spring St, Weymouth, MA 02188 and is currently estimated at $616,319, approximately $523 per square foot. 41 Spring St is a home located in Norfolk County with nearby schools including Academy Avenue Elementary School, Abigail Adams Middle School, and Weymouth Middle School Chapman.
Ownership History
We collect this data history from publicly available records. To have your information removed, we recommend requesting removal directly through your county’s website.
Purchase Details
Home Financials for this Owner
Home Financials are based on the most recent Mortgage that was taken out on this home.Home Values in the Area
Average Home Value in this Area
Purchase History
We collect this data history from publicly available records. To have your information removed, we recommend requesting removal directly through your county’s website.
| Date | Buyer | Sale Price | Title Company |
|---|---|---|---|
| $132,000 | -- |
Mortgage History
We collect this data history from publicly available records. To have your information removed, we recommend requesting removal directly through your county’s website.
| Date | Status | Borrower | Loan Amount |
|---|---|---|---|
| Closed | $114,000 |
Tax History
We collect this data history from publicly available records. To have your information removed, we recommend requesting removal directly through your county’s website.
| Year | Tax Paid | Tax Assessment Tax Assessment Total Assessment is a certain percentage of the fair market value that is determined by local assessors to be the total taxable value of land and additions on the property. | Land | Improvement |
|---|---|---|---|---|
| 2025 | $5,299 | $524,700 | $199,200 | $325,500 |
| 2024 | $5,132 | $499,700 | $189,700 | $310,000 |
| 2023 | $4,723 | $452,000 | $175,700 | $276,300 |
| 2022 | $4,597 | $401,100 | $162,700 | $238,400 |
| 2021 | $4,307 | $366,900 | $162,700 | $204,200 |
| 2020 | $4,033 | $338,300 | $162,700 | $175,600 |
| 2019 | $3,933 | $324,500 | $156,400 | $168,100 |
| 2018 | $3,809 | $304,700 | $148,900 | $155,800 |
| 2017 | $3,723 | $290,600 | $141,900 | $148,700 |
| 2016 | $3,576 | $279,400 | $136,400 | $143,000 |
| 2015 | $3,106 | $240,800 | $136,400 | $104,400 |
| 2014 | $3,000 | $225,600 | $127,000 | $98,600 |
Map
- 40 Bell Rd
- 22 Priscilla Cir
- 114 Meredith Way
- 29 Karen Ln
- 11 Old Country Way
- 19 Essex Heights Dr
- 80 Kensington Rd
- 53 Concannon Cir
- 42 Kensington Rd
- 83 Wilson Ave
- 484 Essex St
- 26 Coolidge Ave
- 43 Harding Ave
- 45 Presidents Rd
- 19 Common St
- 33 Hunt St
- 61 Broad St
- 13 Alden Rd
- 229 Lake St Unit D
- 235 Lake St Unit D
Ask me questions while you tour the home.