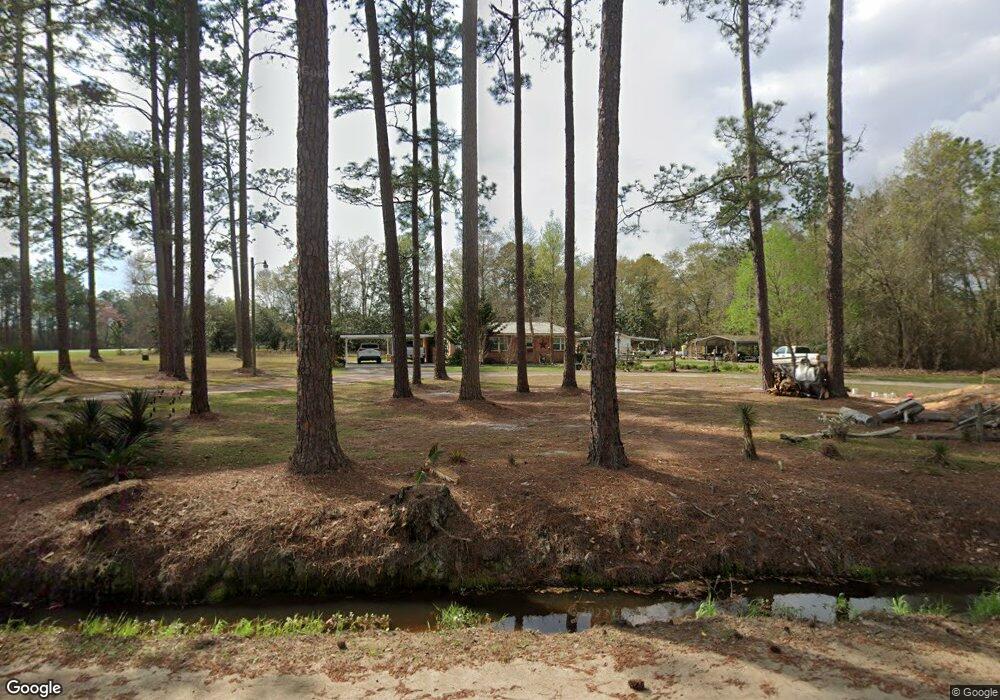
41 Tommy Meeks Rd Nicholls, GA 31554
Estimated Value: $112,159 - $205,000
Studio
--
Bath
1,418
Sq Ft
$103/Sq Ft
Est. Value
About This Home
This home is located at 41 Tommy Meeks Rd, Nicholls, GA 31554 and is currently estimated at $146,040, approximately $102 per square foot. 41 Tommy Meeks Rd is a home with nearby schools including Nicholls Elementary School, Coffee Middle School, and Coffee County High School.
Create a Home Valuation Report for This Property
The Home Valuation Report is an in-depth analysis detailing your home's value as well as a comparison with similar homes in the area
Home Values in the Area
Average Home Value in this Area
Tax History
| Year | Tax Paid | Tax Assessment Tax Assessment Total Assessment is a certain percentage of the fair market value that is determined by local assessors to be the total taxable value of land and additions on the property. | Land | Improvement |
|---|---|---|---|---|
| 2025 | $610 | $27,635 | $7,921 | $19,714 |
| 2024 | $607 | $27,635 | $7,921 | $19,714 |
| 2023 | $612 | $27,636 | $7,921 | $19,714 |
| 2022 | $671 | $27,635 | $7,921 | $19,714 |
| 2021 | $671 | $27,635 | $7,921 | $19,714 |
| 2020 | $671 | $27,635 | $7,921 | $19,714 |
| 2019 | $671 | $27,635 | $7,921 | $19,714 |
| 2018 | $671 | $27,635 | $7,921 | $19,714 |
| 2017 | $674 | $27,635 | $7,921 | $19,714 |
| 2016 | $674 | $27,635 | $7,921 | $19,714 |
| 2015 | $678 | $27,636 | $7,921 | $19,714 |
| 2014 | $672 | $27,251 | $7,921 | $19,330 |
Source: Public Records
Map
Nearby Homes
- 503 N Mill St
- 701 van Streat Hwy
- 700 Burdell Ave & 0 Coffee
- 901 van Streat Hwy
- 601 Van St
- Jim Meeks Rd
- Jim Meeks Rd
- Jim Meeks Rd
- Jim Meeks Rd
- Tract 2 Jim Meeks Rd
- Tract 1 Jim Meeks Rd
- 1505 El Curtis Rd
- 130 Rocky Meadow Rd
- 569 Bobcat Trail
- 15 Bobcat Trail
- 800 Apaloosa Rd
- 1610 Sikes Rd
- 360 Wildwood Rd
- 525 Drake Dr
- Lot #90 Mallard Pointe
- 9597 Ga Highway 32 E
- 85 Tommy Meeks Rd
- 29 Whipporwill Rd
- 215 Tommy Meeks Rd
- 848 George Teston Rd
- 9403 Ga Highway 32 E
- 321 Tommy Meeks Rd
- 163 Sage Ln
- 000 George Teston Rd
- 470 Tommy Meeks Rd
- 460 George Teston Rd
- 508 Tommy Meeks Rd
- 9193 Ga Highway 32 E
- 9193 Ga Highway 32 E
- 274 George Teston Rd
- 9165 Georgia 32
- 9165 Ga Highway 32 E
- 46 Whipporwill Rd
- 566 Tommy Meeks Rd
- 205 George Teston Rd
Your Personal Tour Guide
Ask me questions while you tour the home.