410 S 5th Ave Mayodan, NC 27027
Estimated Value: $130,000 - $170,434
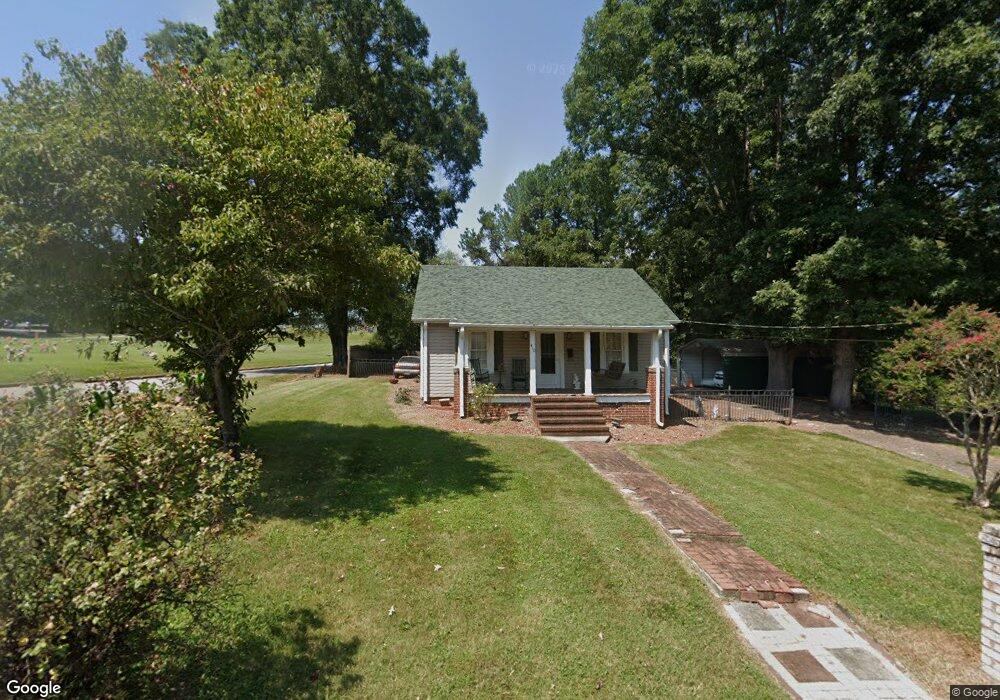
About This Home
This home is located at 410 S 5th Ave, Mayodan, NC 27027 and is currently estimated at $150,859, approximately $145 per square foot. 410 S 5th Ave is a home located in Rockingham County with nearby schools including Western Rockingham Middle School, John W Dillard Elementary, and John W. Dillard Academy.
Ownership History
We collect this data history from publicly available records. To have your information removed, we recommend requesting removal directly through your county’s website.
Purchase Details
Purchase Details
Home Financials for this Owner
Home Financials are based on the most recent Mortgage that was taken out on this home.Home Values in the Area
Average Home Value in this Area
Purchase History
We collect this data history from publicly available records. To have your information removed, we recommend requesting removal directly through your county’s website.
| Date | Buyer | Sale Price | Title Company |
|---|---|---|---|
| $75,500 | None Available | ||
| $705,000 | None Available |
Mortgage History
We collect this data history from publicly available records. To have your information removed, we recommend requesting removal directly through your county’s website.
| Date | Status | Borrower | Loan Amount |
|---|---|---|---|
| Previous Owner | $66,500 |
Tax History
We collect this data history from publicly available records. To have your information removed, we recommend requesting removal directly through your county’s website.
| Year | Tax Paid | Tax Assessment Tax Assessment Total Assessment is a certain percentage of the fair market value that is determined by local assessors to be the total taxable value of land and additions on the property. | Land | Improvement |
|---|---|---|---|---|
| 2025 | $1,733 | $139,187 | $9,896 | $129,291 |
| 2024 | $1,733 | $139,187 | $9,896 | $129,291 |
| 2023 | $1,015 | $72,996 | $8,996 | $64,000 |
| 2022 | $993 | $72,996 | $8,996 | $64,000 |
| 2021 | $967 | $72,996 | $8,996 | $64,000 |
| 2020 | $967 | $72,996 | $8,996 | $64,000 |
| 2019 | $967 | $72,996 | $8,996 | $64,000 |
| 2018 | $959 | $72,357 | $11,996 | $60,361 |
| 2017 | $959 | $72,357 | $11,996 | $60,361 |
| 2015 | $969 | $72,357 | $11,996 | $60,361 |
| 2014 | $959 | $72,357 | $11,996 | $60,361 |
Map
- 112 Taft St
- 212 S 6th Ave
- 101 S 8th Ave
- 209 N 6th Ave
- 209 N 2nd Ave
- 7th S 12th Ave
- 305 N 10th Ave
- 100 Coleman St
- 401 N 3rd Ave
- 804 Ridge St
- 900 W Monroe St
- 1007 W Jackson St
- 00 Poole Rd
- 806 N 7th Ave
- 44 +/- AC Island Dr
- 6601 Nc Highway 704
- 17.2 Acres Davie Ln
- 8.6 Acres Davie Ln
- 213 W Decatur St
- 21 Highway 704
Ask me questions while you tour the home.